Hello! We're excited to bring you this midweek (Wednesday) edition of top trade ideas and market insights. Stay ahead with OptionEdge.ai! 🚀
Welcome to Your Midweek Insights 🎯
Wednesday's Trading Updates and Opportunities
By OptionEdge.ai
Exclusive Premium Content
This content is exclusive to premium members.
Market Recap - 29 Oct 2024
Market momentum has slowed, reflected in low trading volume. Rising 10-year yields are creating headwinds, and with just days until the election, the rally is stalling. Earnings are mixed, with semiconductors, led by AMD, reporting lower guidance for next quarter. Consumer staples like McDonald's (MCD) and Chipotle (CMG) posted solid year-over-year growth outlooks but have yet to see positive market reactions. Both Tesla (TSLA) and Google beat earnings estimates, though expectations were low. Political uncertainty remains high, but the market’s movements are relatively calm for now.
- SPY (S&P 500 ETF): Over the past two days, SPY followed its recent trend, initially dipping before recovering. The 10-year Treasury yield closed above 4.2%, adding pressure on equities. The VIX closed at 19.68, reflecting persistent uneasiness. Technically, the ADX is positive, and stochastics remain neutral. S&P 500 companies have reported collective earnings growth of 4% year-over-year, which might typically lead to a market correction. However, a dovish Federal Reserve is providing substantial support to the market through ample liquidity.
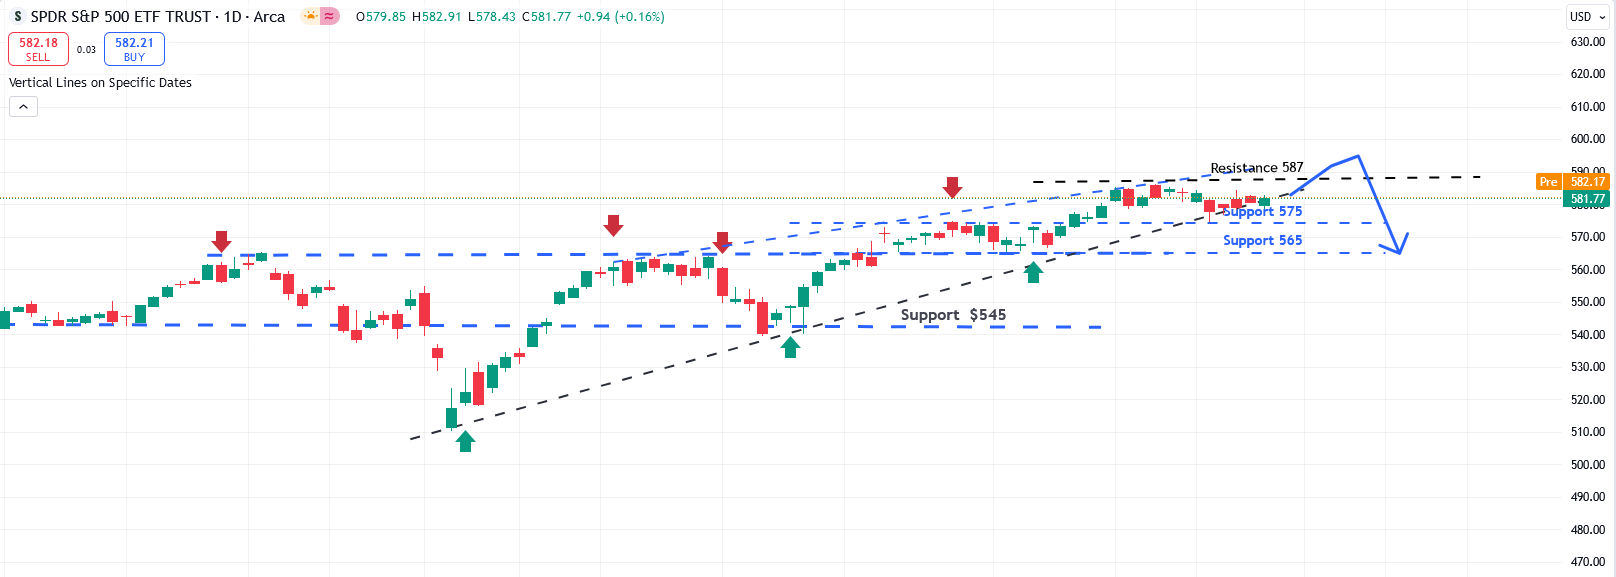
- Looking ahead SPY (S&P 500 ETF):Major economic reports, including the PCE index and
Payroll numbers, are set to be released in the next two days. These are the last significant reports
before the election and could substantially influence market sentiment. Additionally, key tech
companies like Microsoft (MSFT), Apple (AAPL), and Meta (META) are scheduled to report their
earnings, which may propel the market to all-time highs by Friday.
According to AI predictions, the expected path is a surge to 586 based on these earnings and
economic reports, with projections to hover around 590 until November 4. After that, a correction
may occur, potentially bringing prices down to 575 and then 565. This outlook reflects a cautious
optimism as the market reacts to critical economic indicators and corporate earnings.
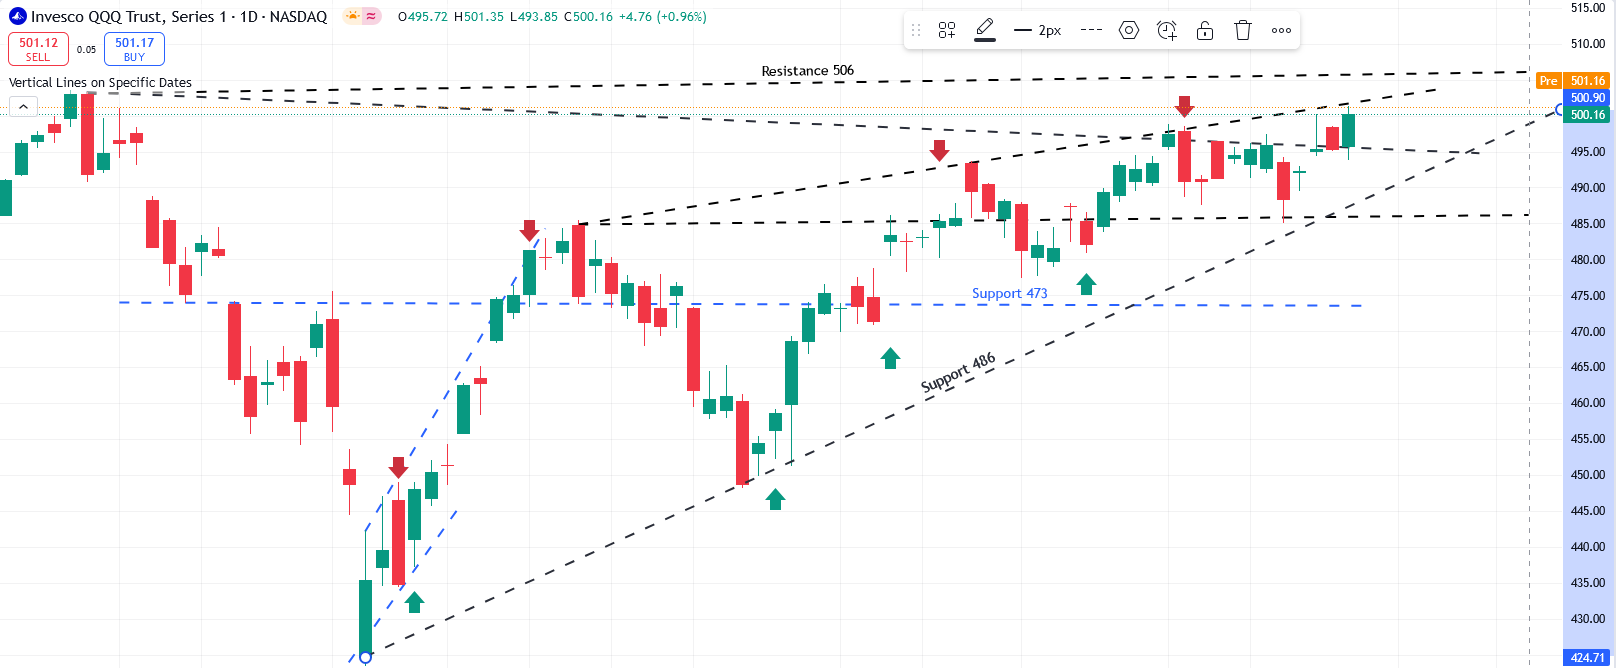
- QQQ (Nasdaq 100 ETF): Similar to SPY, QQQ initially dipped but has shown resilience, attracting buyers. Anticipation of earnings from the remaining "Magnificent 7" is helping maintain momentum and providing strength to QQQ. Although semiconductor stocks are facing some pressure, technical indicators such as ADX and stochastics are turning upward, suggesting a positive setup with potential to approach all-time highs by Friday. However, this outlook depends on no negative surprises from the remaining mega-cap tech earnings.
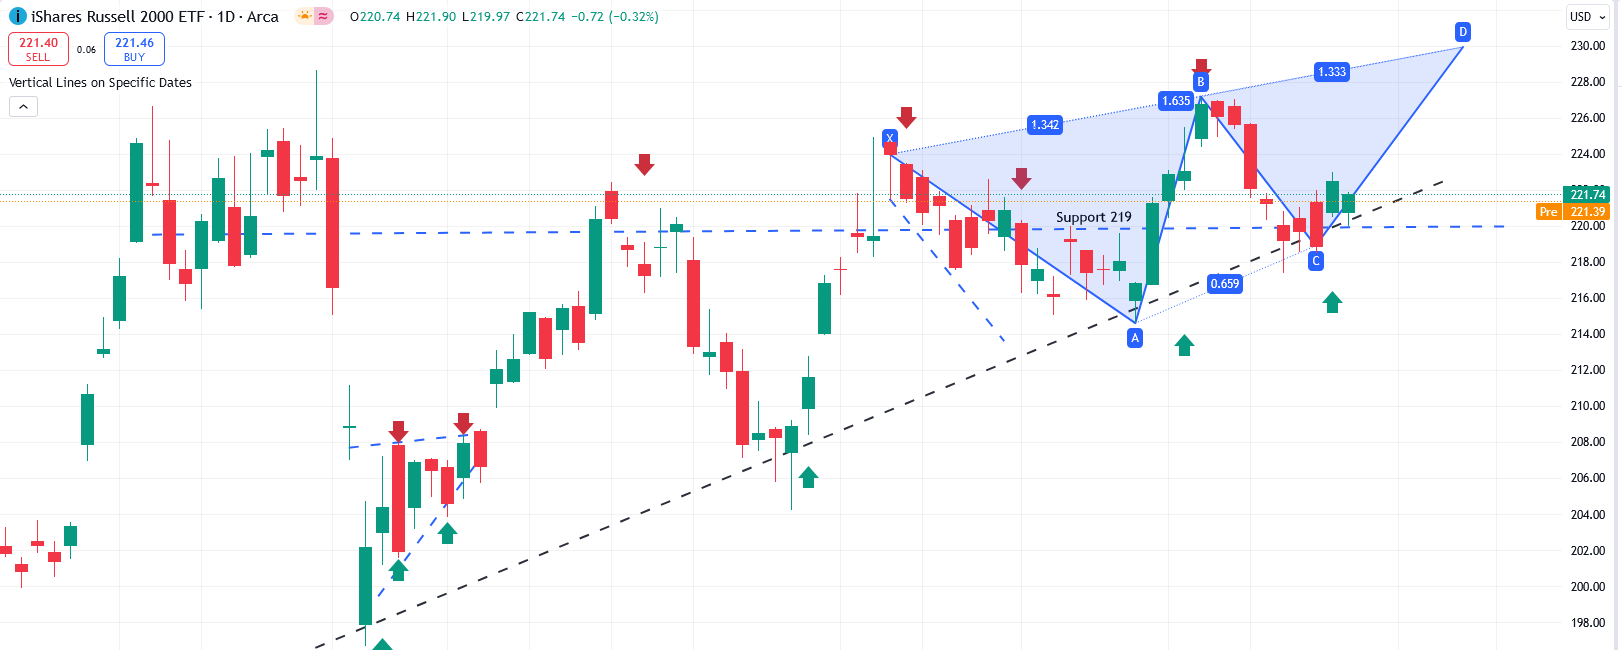
- IWM (Russell 2000 ETF): It remains in an uptrend, consolidating near the 220 mark. Rising yields could create some pressure on small-cap valuations, as higher rates generally challenge growth in this sector. However, price-to-earnings (PE) expansion may be possible if the 10-year yield eases. A solid economic report in the next two days could give small caps a welcome boost, particularly as we approach the election.
Action Plan for the Week
Looking ahead, the market's focus will shift to key earnings reports from Microsoft (MSFT), Apple (AAPL), Meta (META), and Amazon (AMZN). We remain cautious, particularly in sectors like semiconductors and financials, which could face continued pressure. However, we maintain a bullish outlook on consumer discretionary stocks, including McDonald's (MCD) and Chipotle (CMG), as well as commodities like gold (GLD) and real estate (IYR), both of which have recently demonstrated signs of strength.
Featured Trade Ideas
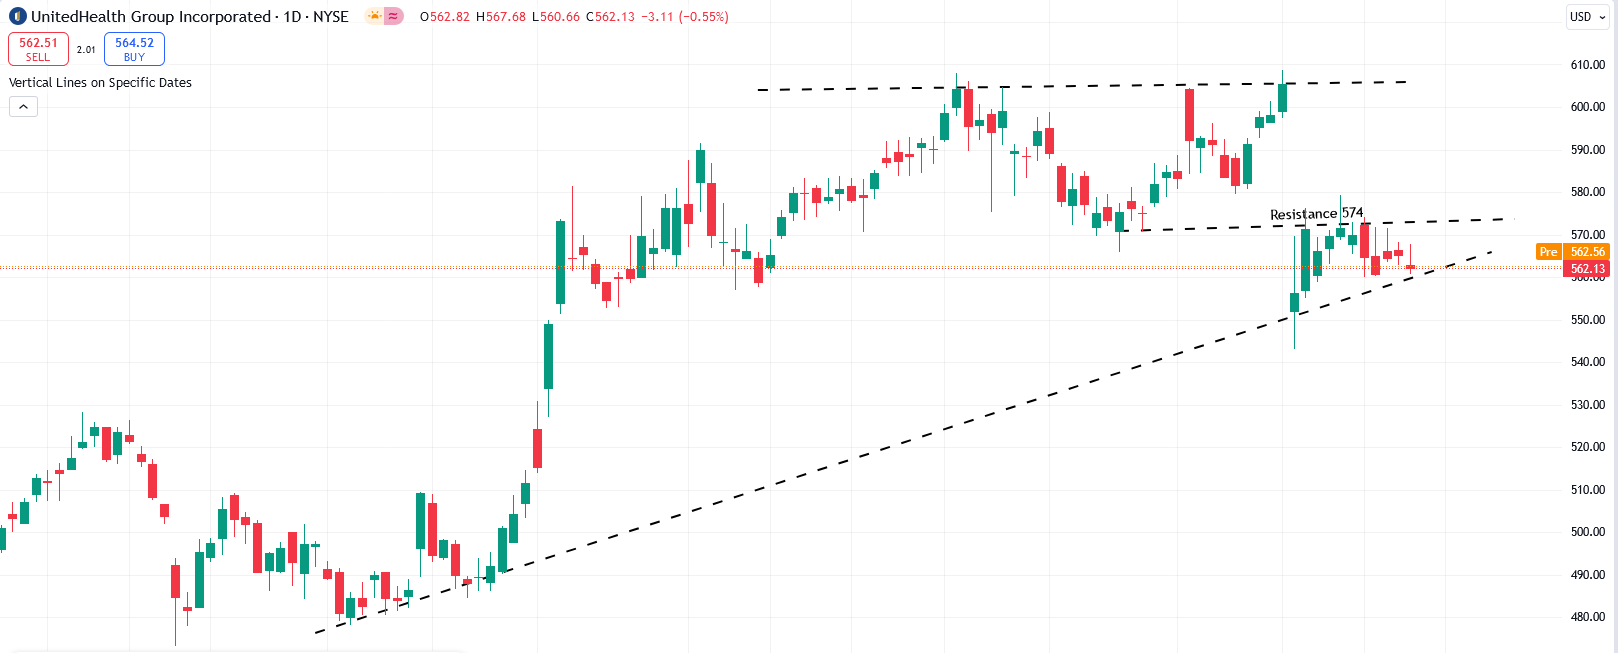
- UnitedHealth Group (UNH): In its latest earnings report, UNH faced higher labor and supply costs, which impacted its bottom line. However, the company reported strong revenue growth. Currently, the ADX indicator remains negative, while stochastics are attempting to find a bottom. If UNH pulls back to around its 100-day moving average at 556, this could present a good entry point for a long position. Immediate resistance is seen at 574.
🔥 Featured Trade Idea: FANG 🔥
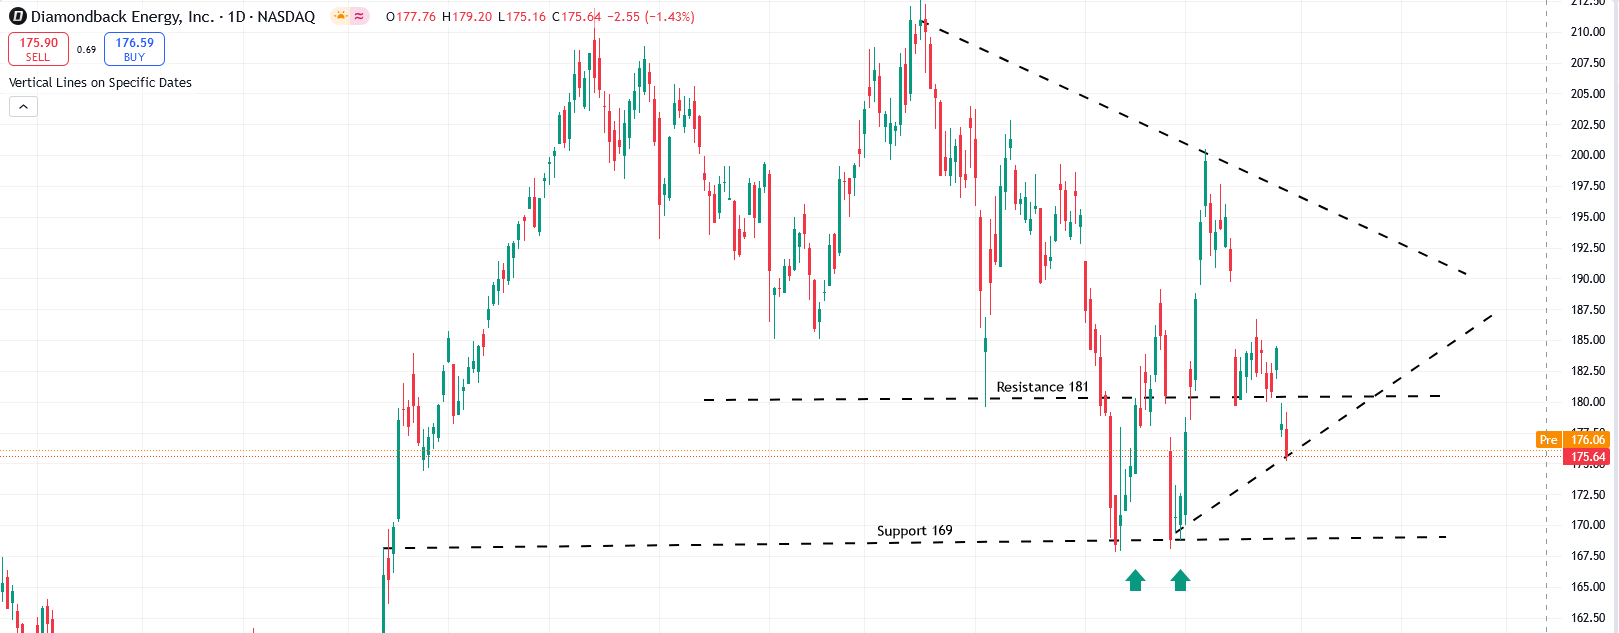
Rationale: Earnings are scheduled for release on November 4th, and we anticipate strong revenue growth. However, as an oil play, Diamondback Energy (FANG) may see short-term volatility based on the election outcome. The stock has already corrected about 15% since its all-time high in July, making it an attractive value play. With winter approaching, oil prices tend to rise, which could benefit oil and energy companies like FANG. The stock is consolidating near 175, and any dip to around 170 could present a favorable long entry. Immediate resistance lies at 184, with potential to reclaim its all-time high within the next 2-3 months
💡 Trading Tip of the Week: "Using Support and Resistance Levels" for Better Trade Decisions 💡
Strategy: Understanding and utilizing support and resistance levels is essential for making informed trading decisions. Support levels indicate where a stock has historically had difficulty falling below, while resistance levels show where it has struggled to rise above. Use these levels to inform your entry and exit points. Consider entering a trade near support levels with a tight stop loss just below, as this can provide a favorable risk-to-reward ratio. Conversely, consider taking profits or placing stop losses near resistance levels, as the price may struggle to break through. This strategy can help you navigate market fluctuations and improve overall trade management.