Hello! We’re excited to bring you this week’s top trade ideas and market insights. Stay ahead with OptionEdge.ai! 🚀
Welcome to Your Weekly Edge 🎯
Weekend Update on Trading Insights and Opportunities
By OptionEdge.ai
Exclusive Premium Content
This is content that only premium members can access.
Market Recap - 25th Oct 2024
In the week ending October 25, 2024, the market showed fading momentum, closing down from the previous week. Key earnings from TSLA and ServiceNow boosted sentiment in the technology sector, helping Big Tech stocks close modestly higher. Despite this positive trend, the CBOE VIX Index—a key indicator of market volatility—remained elevated, finishing the week above 20. Let’s explore the primary factors driving these market dynamics in more detail.
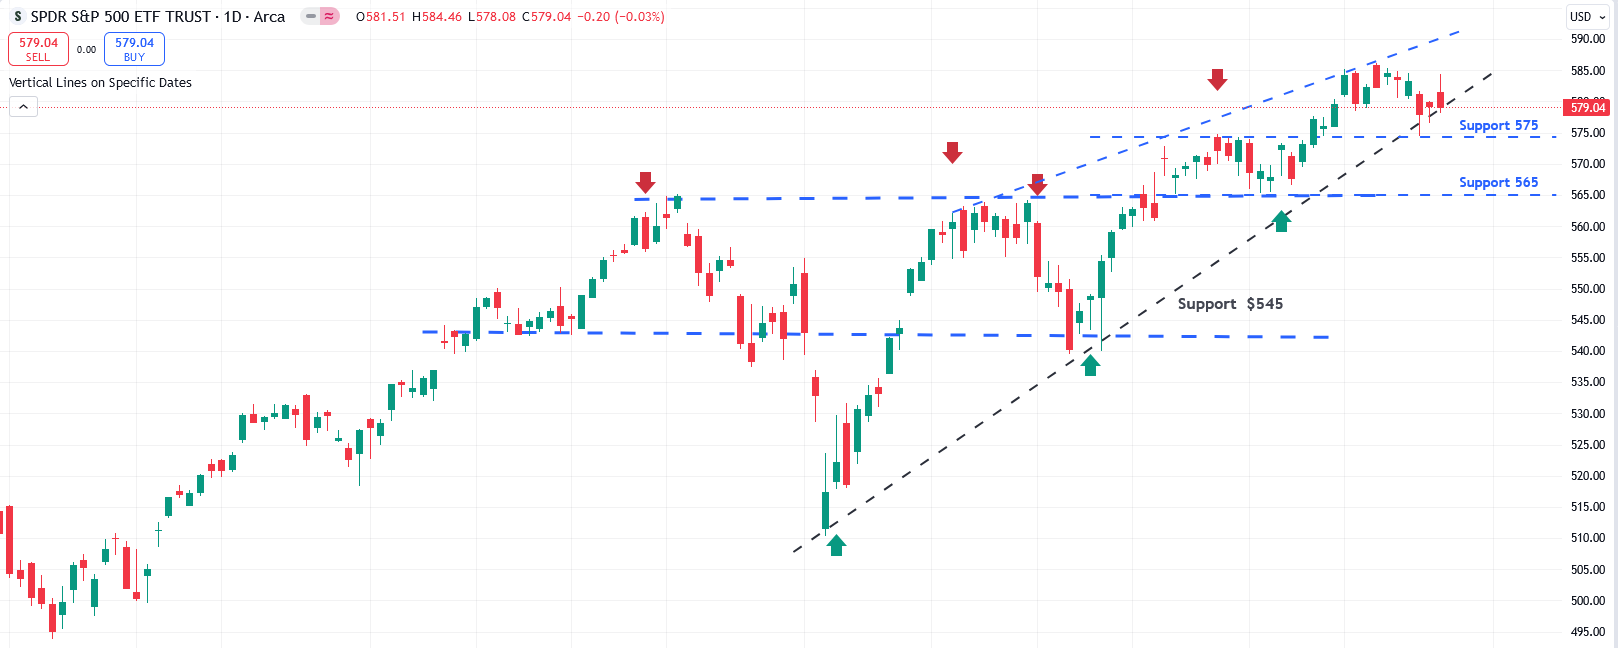
- SPY (S&P 500 ETF): The market began the week on a cautious note, weighed down by heightened geopolitical tensions, election uncertainties, and rising yields on the 10-year Treasury. Midweek, SPY was down nearly 2%, but strong tech earnings helped boost sentiment, pulling it up by the end of the week. Trading close to the 576 level, as forecasted by last week’s AI model, SPY recovered to close at 579.04, down just 0.95% from the prior week. While earnings have been largely unremarkable, this recovery was driven primarily by sector re-allocations from institutions in anticipation of the upcoming election. NVIDIA’s notable resilience contributed positively, lending further support to the broader market and underscoring the market’s capacity to withstand pressures amid uncertain conditions.
- Looking Ahead:As highlighted in last week’s update, market divergence is continuing to widen. Key indicators of this trend include fading momentum in emerging economies such as India, rising gold prices, increasing yields, a persistently elevated VIX, and Big Tech's struggle to regain its all-time highs from July. The 10-year yield closed around 4.24%, while the 30-year fixed mortgage rate is hovering near 6.9%, up 0.5% from last week, signaling potential market instability. However, the Fed's ample liquidity continues to act as a strong tailwind, helping sustain market momentum. Macroeconomic concerns remain significant, including ongoing weaknesses in commercial real estate, high food prices, reduced job openings, weak auto sales, and sluggish industrial demand. Despite these challenges, we anticipate the upcoming PCE report on October 31st will continue to cool inflation, and the payroll data on November 1st may show slight improvement, potentially boosted by election-related influences. This data could drive SPY toward a new all-time high around 588 to 590. Looking ahead to the coming week, we expect a two-phase pattern: a weaker start, with SPY likely testing the 575 to 570 range, followed by a potential rally in the latter half, closing higher around 588 to 590 by week’s end.
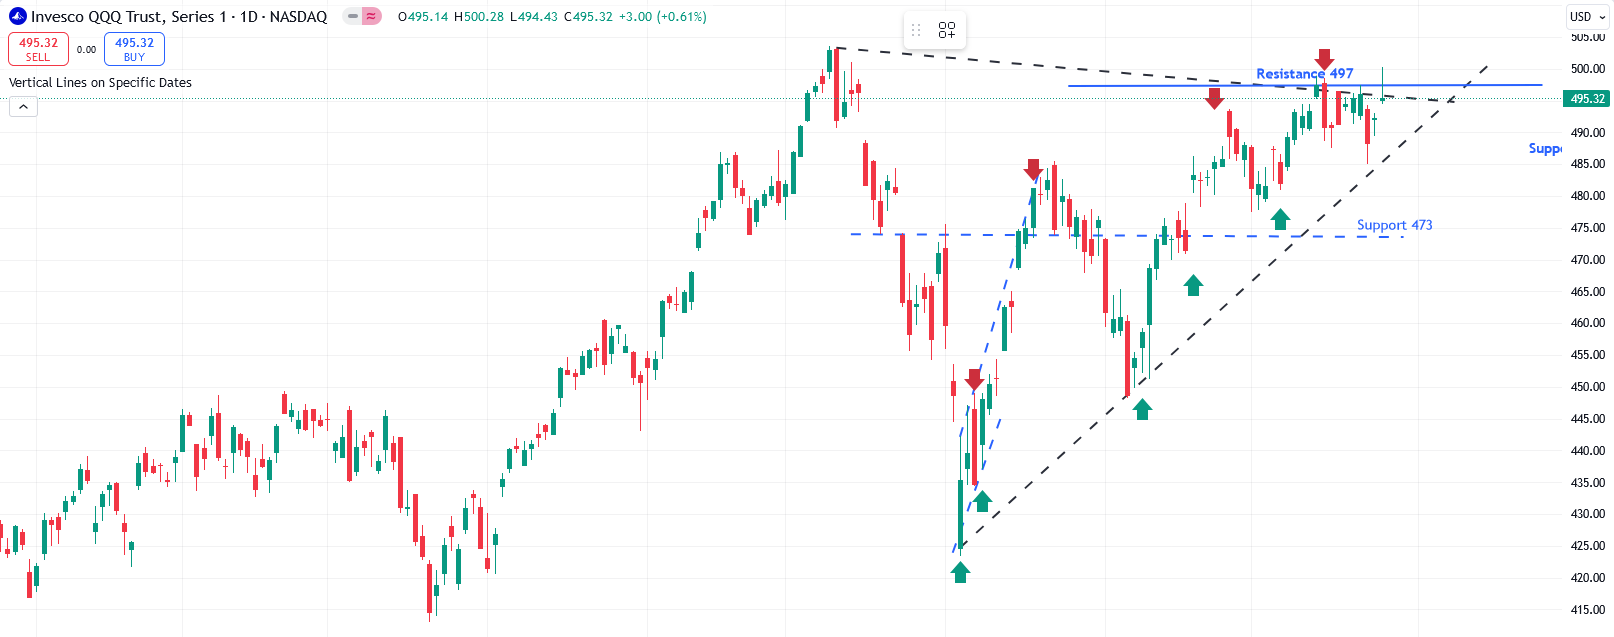
- QQQ (Nasdaq 100 ETF): Similar to SPY, QQQ started the week on a downtrend but managed to recover, closing 0.17% higher than the prior week. However, it has yet to reclaim its all-time high (ATH) from July. Till now, key earnings from NFLX, TSLA and NOW are showing resilience and helped QQQ to stay positive. As we mentioned in last weekly edge, TSLA had post earning swing rally due to being Trump trade and it was not based on earnings.
- Looking Ahead: QQQ closed close to its previous week's level, finding support near 494. We anticipate a pullback in the first half of the week, with a likely retest of support levels around 485 and 478 as MACD and Stochastics indicate weakness and fading momentum. Next week is packed with key earnings, including notable reports from PYPL, GOOG, AMD, and Visa on Tuesday; MSFT, META, CAT, and HOOD on Wednesday; and AMZN, and AAPL on Thursday. We expect QQQ to recover from early weakness, closing slightly positive by the end of the week. We also anticipate that LLY could report a substantial earnings surprise as its weight-loss medication gains worldwide attention, potentially making it the first trillion-dollar market cap in the pharma sector—a stock we highly recommend for the long term. Microsoft is likely to report strong earnings as it embarks on cost-cutting measures and continues to gain traction with Azure services, which keeps our outlook bullish. Similarly, META may deliver positive earnings, though high CAPEX spending could weigh on its stock price. Also, rght after earnings, the Corp buy back starts, so in the anticipation of it, market would recover in second half of week. Overall, we expect QQQ to start the week weak but end with slight gains. Investors might consider a long position if there’s a market dip by Wednesday. However, if no correction occurs in the first three days, it may be wise to avoid chasing it.
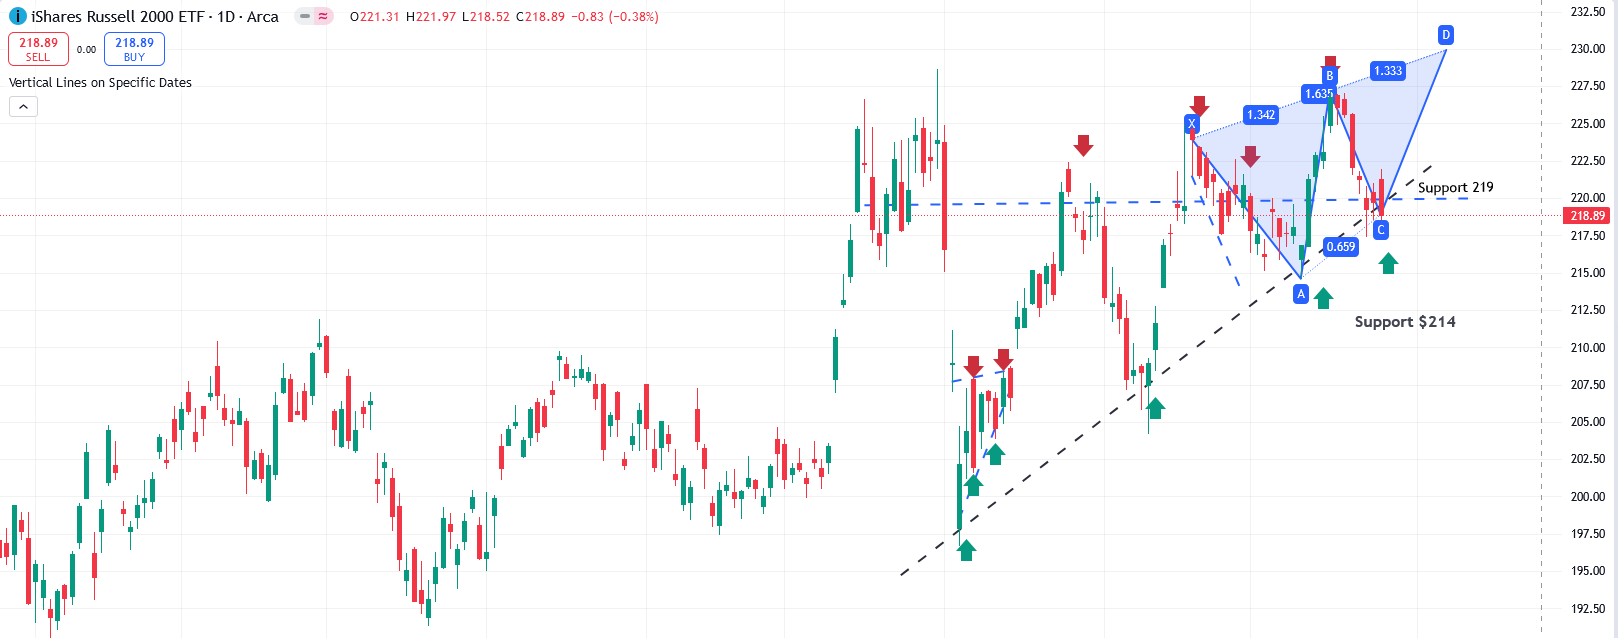
- IWM (Russell 2000 ETF): In contrast to the large-cap indices, IWM closed nearly 3% down from the previous week’s close, hitting the 218 level as projected by our AI model last week. As outlined in last week’s WeeklyEdge report, IWM is following an ABCD pattern, with the recent pullback to 218 marking the C point. It found support at its 50-day moving average, which acted as a strong support level and facilitated a bounce.
- Looking Ahead: We continue to believe that small caps stand to benefit the most from any easing in Fed rates. While technical indicators currently show weakness and fading momentum, this could be the pivotal moment for a turnaround in small caps. With sector reallocation likely ahead of the election and the upcoming PCE report on Thursday, sentiment could improve, supporting small caps in closing the week higher.
In summary, while SPY suppoted by mixed performance, QQQ was supported by better performances from the recent earnings from TSLA and NOW, helping the index close the week on a positive note. Meanwhile, IWM down with fading momentum.
Interest Rates:
The U.S. 10-year Treasury yield continued its upward trajectory, reaching approximately 4.24%, which could weigh on equity sentiment. This increase reflects the market's adjustment to the broader economic outlook. While a potential rate cut by the Federal Reserve could influence shorter-term rates, such as the 2-year Treasury, longer-term yields like the 10-year are more aligned with market expectations for future economic growth and inflation. We expect the 10-year rate to decrease as this rise seems unwarranted unless recession concerns re-emerge. With potentially favorable PCE data on Thursday and payroll numbers on Friday—just days before the election—we anticipate an upward move for TLT.
Next Week's Action Plan:
Looking ahead, with just a week remaining until the election, we anticipate heightened political drama and increased market volatility. As previously noted, the market is showing signs of fading momentum, a pattern that often precedes a sharp pullback. This calls for vigilance, as the potential for sudden market shifts is elevated in the lead-up to the election. However, strong earnings from the “Magnificent 7” tech stocks, combined with positive PCE and payroll data, are expected to help lift market sentiment by the week’s end.
Featured Trade Ideas
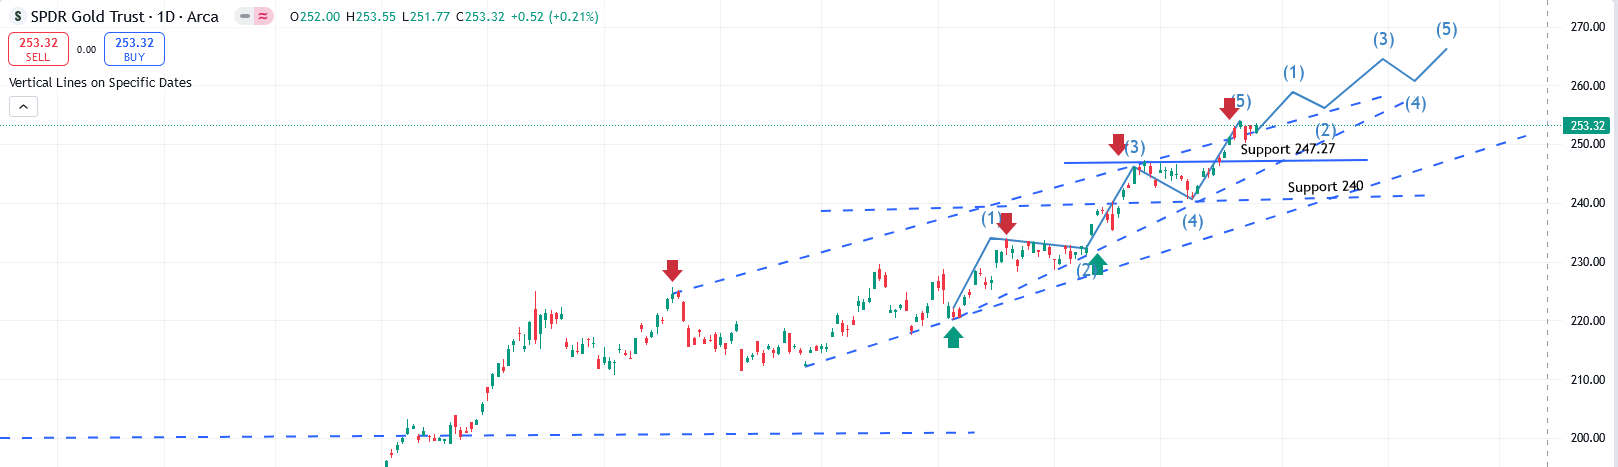
- Gold ETF (GLD): Gold is following a rising ABCD pattern. As projected by our AI model last week, the price target was 255, and it came close to 254. We anticipate it will rise to the range of 255 to 256 before dipping back down to around 252 as part of the ABCD pattern.
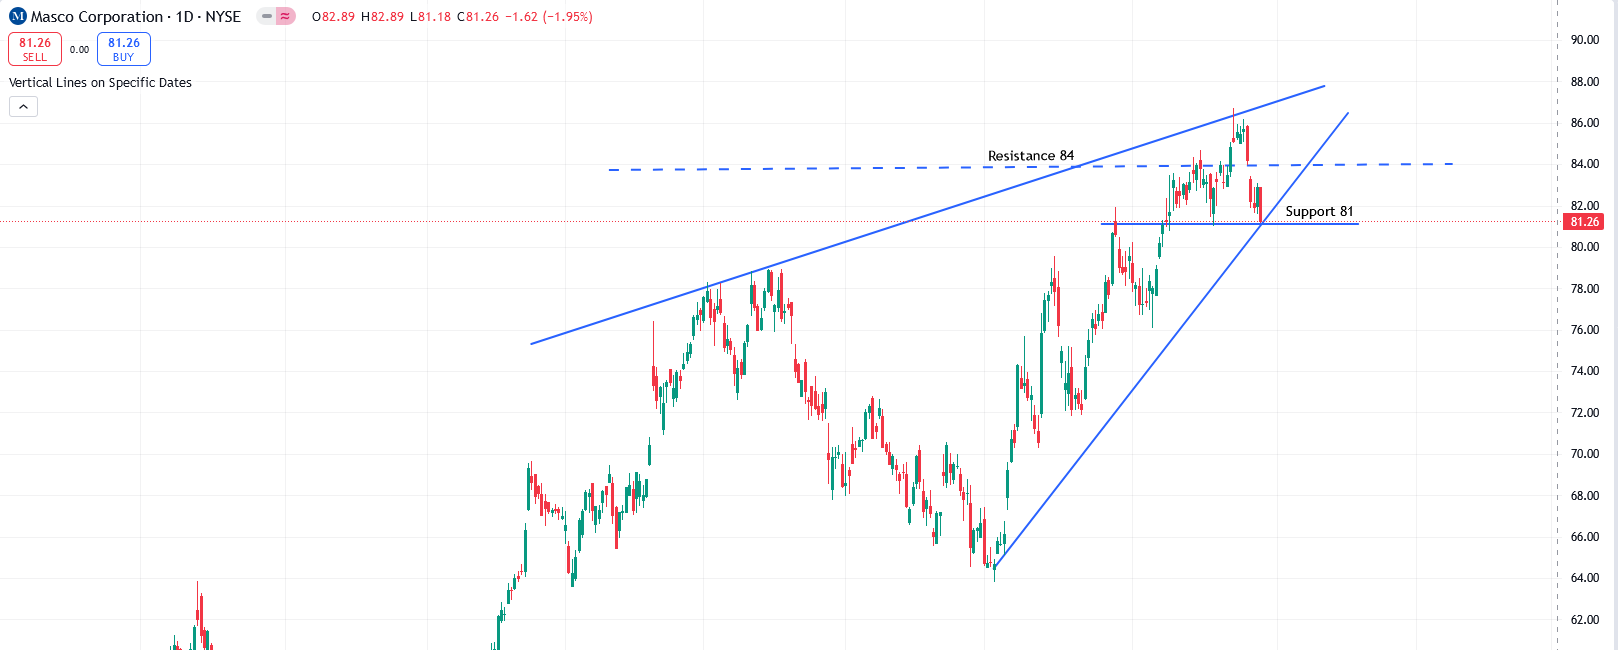
- Masco (MAS): The stock is currently resting on its 50-day moving average at 81.26. Stochastics are bottoming out with fading momentum; however, the ADX indicates a potential coiling pattern, which could signal a resumption of the uptrend. Next week's earnings report will be crucial, and technical indicators suggest a return to an uptrend targeting 85 following the earnings announcement. Masco, a leading manufacturer of home improvement and building products, is well-positioned to benefit from ongoing trends in residential construction and home renovation.
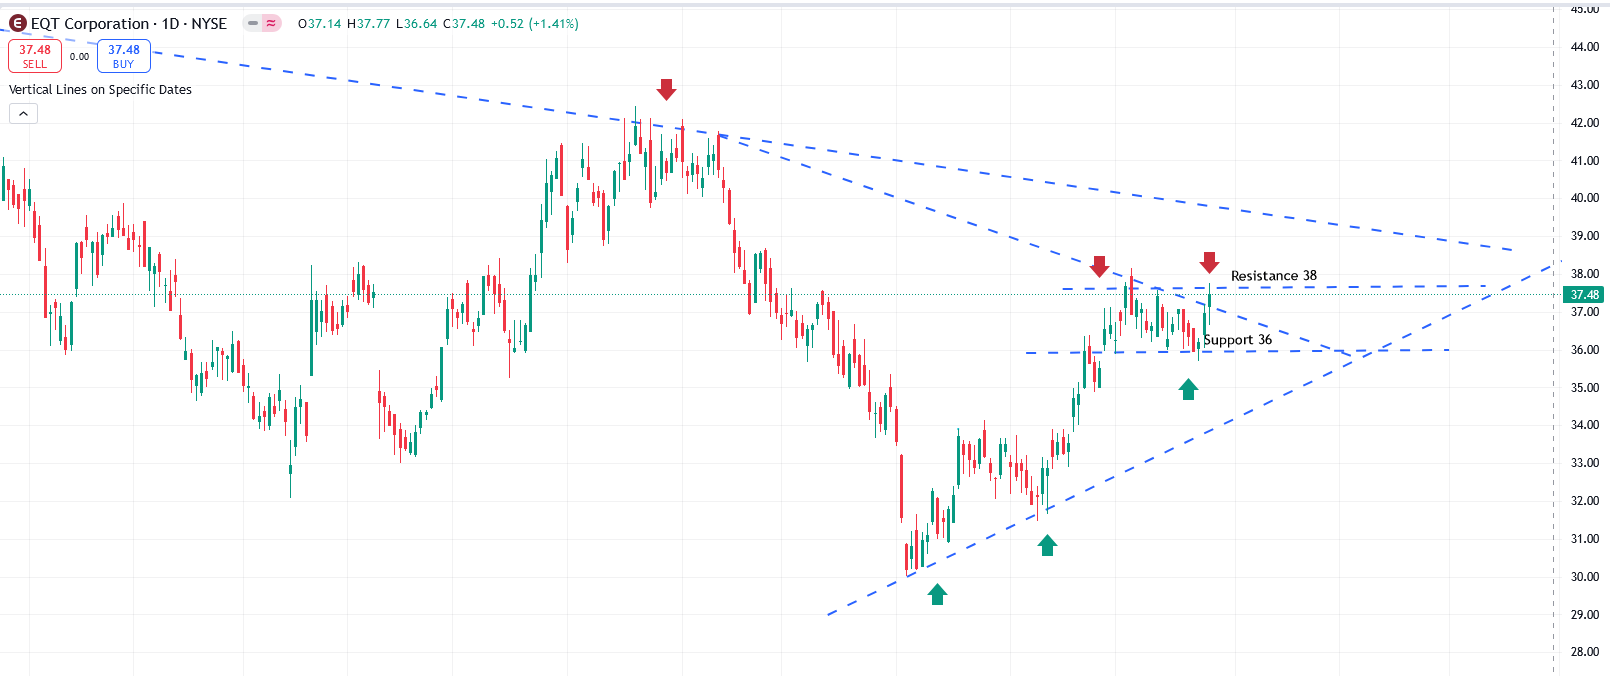
- EQT (EQT): Technical indicators suggest a potential turnaround, with the stock expected to move toward 39, followed by a rise to 41. Stochastics, ADX, and momentum indicators are all showing signs of improvement. As one of the leading natural gas producers in the U.S., EQT stands to benefit from increased demand for cleaner energy sources in the ongoing transition toward more sustainable practices.
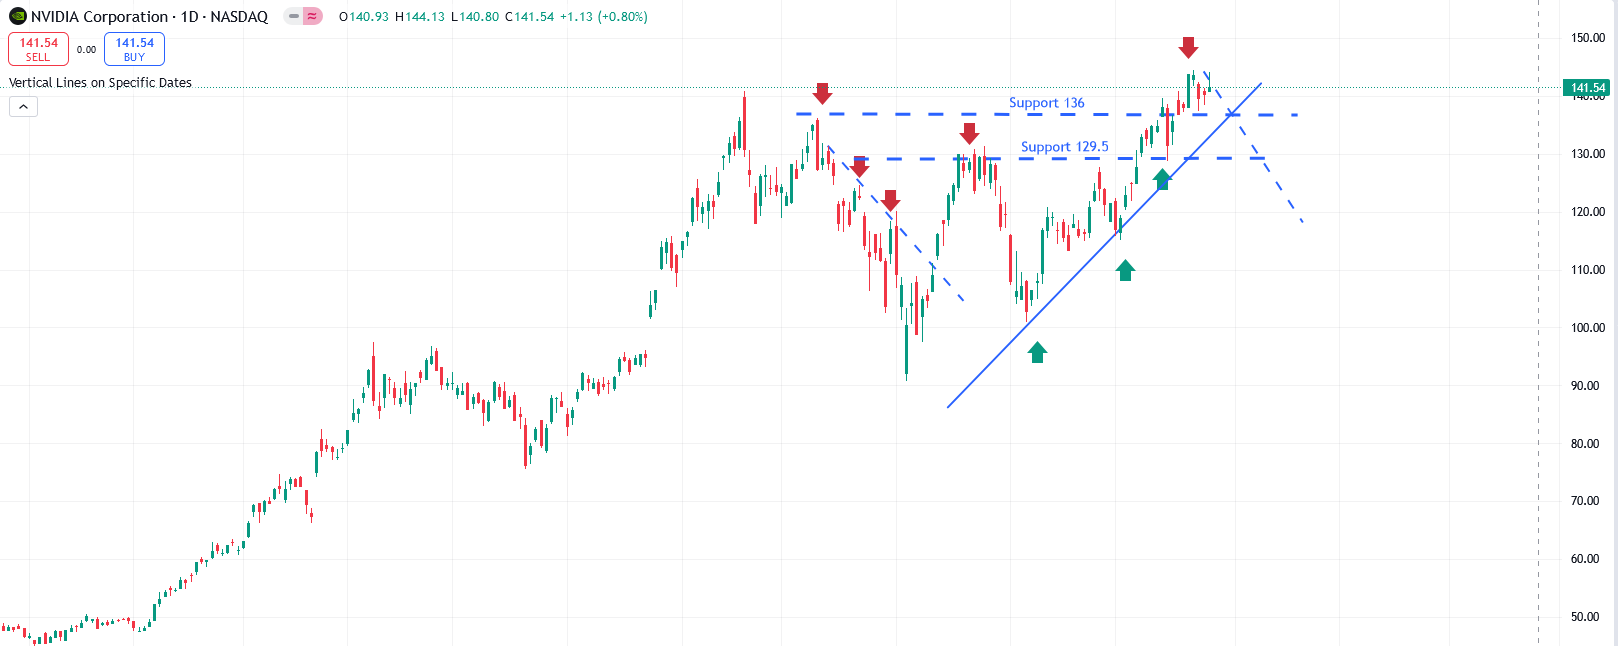
- Nvidia (NVDA): Technicals indicate consolidation near all-time highs (ATH). Stochastics are turning negative, suggesting a potential MACD reversal soon, which could be followed by a decline in momentum. Additionally, ahead of the election, we anticipate sector reallocation, with semiconductors likely to be impacted by Trump's strong tariff policies. As a result, we expect weakness leading up to the election until the company reports its earnings. Our AI model also projects a decline, predicting a close near 136 by the end of the week.
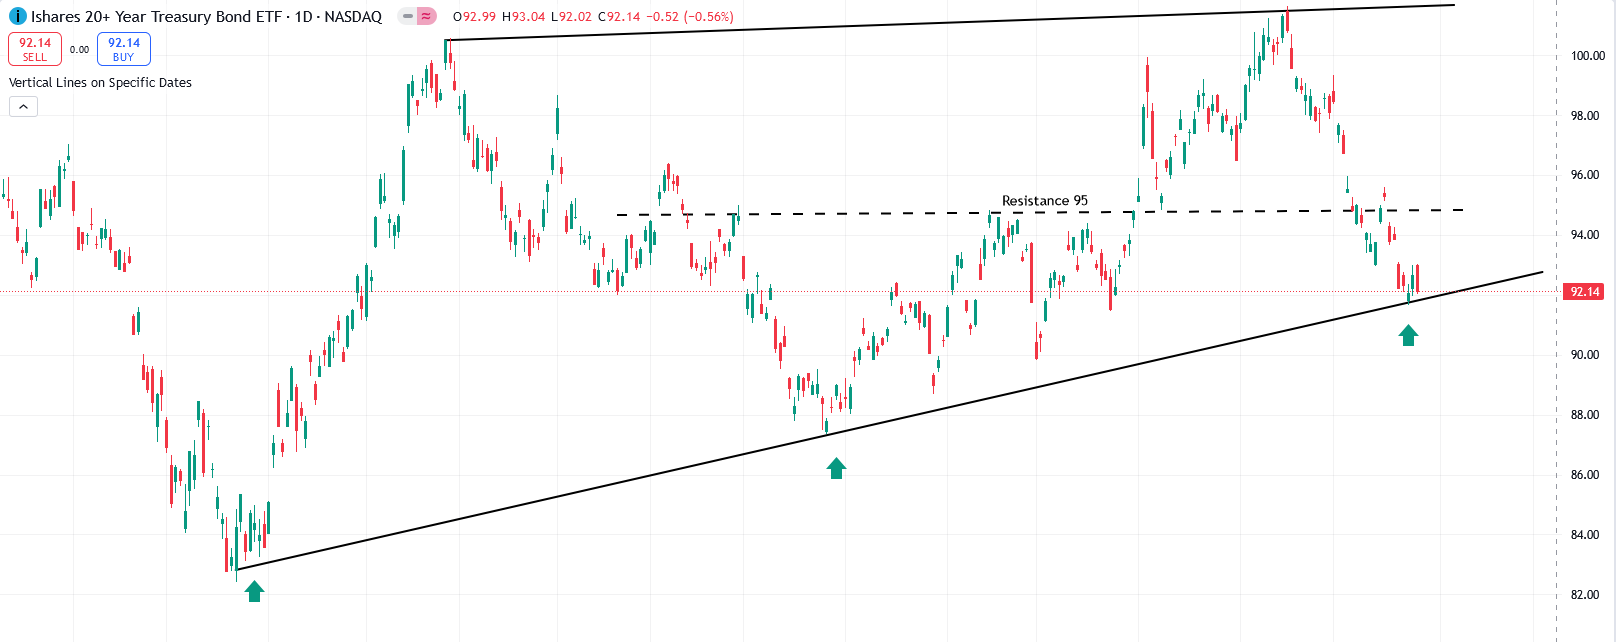
- iShares 20+ Year Treasury Bond ETF (TLT):It is resting on a trend line, with both the Average Directional Index (ADX) and Stochastics indicating a potential bottom. We expect it to resume its uptrend toward 95 to 96 by the end of the week. Technically, the indicators suggest a turnaround from trendline support. Additionally, we anticipate a cooling PCE report, which would provide fundamental support for the 10-year Treasury yield to resume its upward movement.
🔥 Featured Trade Idea: Microsoft (MSFT) 🔥
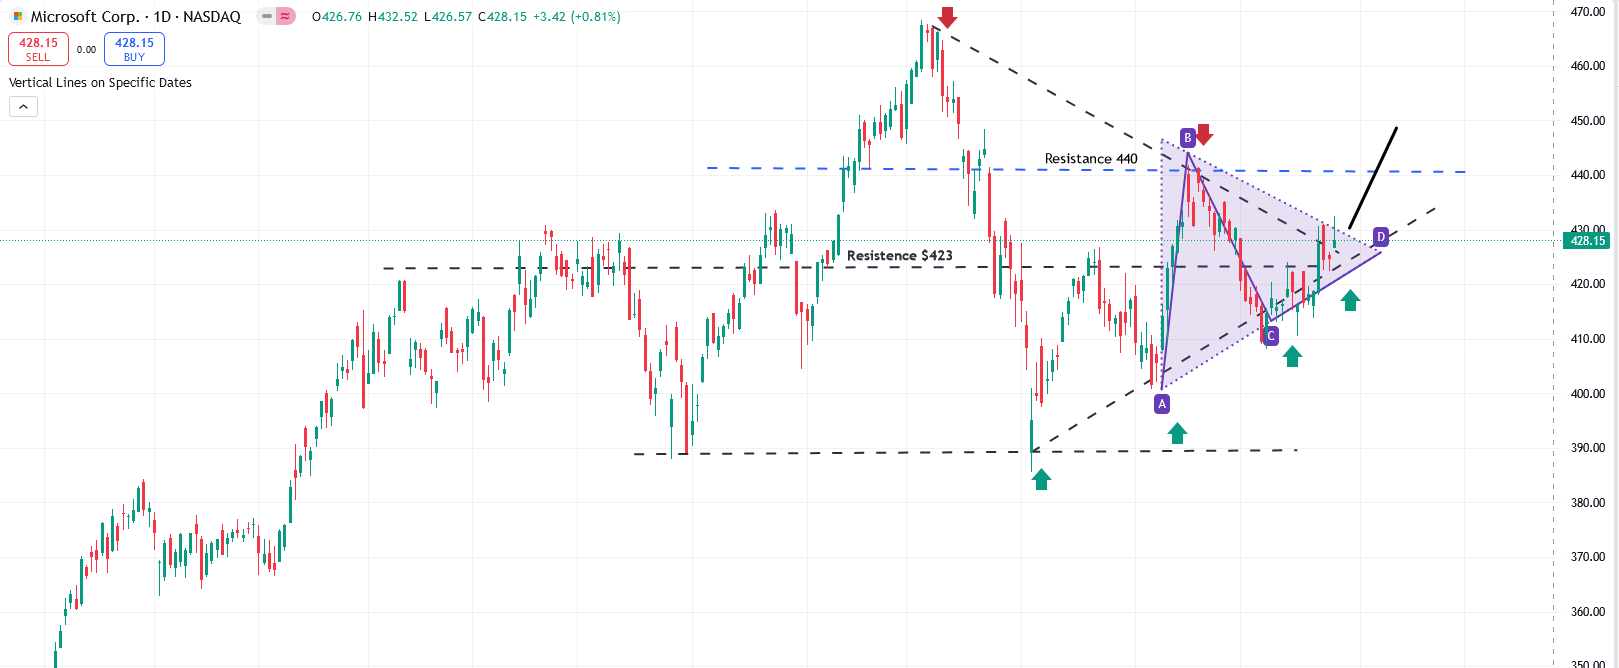
Rationale: MSFT closed above its 50-day moving average, indicating strong support at this level. Both the Average Directional Index (ADX) and the Moving Average Convergence Divergence (MACD) are exhibiting bullish setups. Despite this positive outlook, there is potential for the stock to decline to the 420 to 423 range before quickly resuming its uptrend toward 428 and 440. The formation of a triangle pattern typically suggests a significant upward movement from position D. Additionally, historically, MSFT tends to experience corrections ahead of its earnings reports, after which it often resumes its upward trajectory. Given its strong fundamentals and position as a leader in the technology sector, the stock remains a solid long-term investment.
💡 Trading Tip of the Week: Harnessing the Power of "Dividend Growth Investing" and "Dollar-Cost Averaging" 💡
Consider adopting a "Dividend Growth Investing" strategy to build wealth over time. By focusing on companies with a history of increasing their dividends, you can create a reliable income stream while benefiting from capital appreciation. Reinvesting these dividends can compound your returns, allowing your investment to grow exponentially. This approach not only provides income but also encourages you to invest in fundamentally strong companies that are likely to perform well over the long term.
To further enhance your investment strategy, implement "Dollar-Cost Averaging." This involves consistently investing a fixed amount of money at regular intervals, regardless of market conditions. This strategy reduces the impact of volatility, as you'll buy more shares when prices are low and fewer when prices are high, averaging out your purchase price over time. By taking emotion out of the equation and sticking to a disciplined investment plan, you can accumulate more shares without trying to time the market.
Additionally, consider setting up automatic contributions to your investment accounts. Automating your investments not only ensures consistent contributions but also promotes disciplined saving. This habit can lead to significant long-term growth, as your investments benefit from compounding returns without the stress of market fluctuations.
Combining these strategies creates a powerful approach to building wealth. By focusing on dividend growth and consistently investing through dollar-cost averaging, you can achieve a balance between income generation and capital appreciation, positioning yourself for financial success over the long term.
This research is intended for OptionEdge AI clients only.
OptionEdge AI subscriptions are limited to a single user, and this research must not be shared, redistributed, or disclosed to others. For more information, please contact support@optionedgeai.com.
Conflicts of Interest
This research reflects the views, opinions, and recommendations of OptionEdge AI. At the time of publication, OptionEdge AI has no knowledge of any material conflicts of interest related to this content.
General Disclosures
OptionEdge AI is an independent research firm and is not registered as an investment advisor or broker-dealer under any federal or state securities laws.
This communication is issued by OptionEdge AI for informational and educational purposes only. It is not a personal recommendation, offer, or solicitation to buy or sell any securities, financial products, or services. This material should not be considered legal, tax, accounting, or investment advice. It is not prepared in compliance with legal requirements to promote the independence of investment research and is not subject to any prohibition on dealing ahead of its dissemination.
This document is intended solely for the recipient and may not be distributed without the prior consent of OptionEdge AI.
Copyright © 2024 OptionEdge AI. All rights reserved. No part of this material may be reprinted, sold or redistributed without the prior written consent of OptionEdge AI