Hello! We're excited to bring you this midweek (Wednesday) edition of top trade ideas and market insights. Stay ahead with OptionEdge.ai! 🚀
Welcome to Your Midweek Insights 🎯
Wednesday's Trading Updates and Opportunities
By OptionEdge.ai
Exclusive Premium Content
This content is exclusive to premium members.
Market Recap - 22 Oct 2024
Market momentum is slowing down. The 10-year yield is rising, which is not bullish for the market. With 8 days left until the election, the rally is stalling. The only consolation is that there is no selling pressure yet. However, something similar happened in January 2018, when the market was rising due to the corporate tax cut, followed by a flash correction in the first week of February 2018. The reason we bring up this analogy is that while it may seem like the market won't decline, history suggests otherwise.
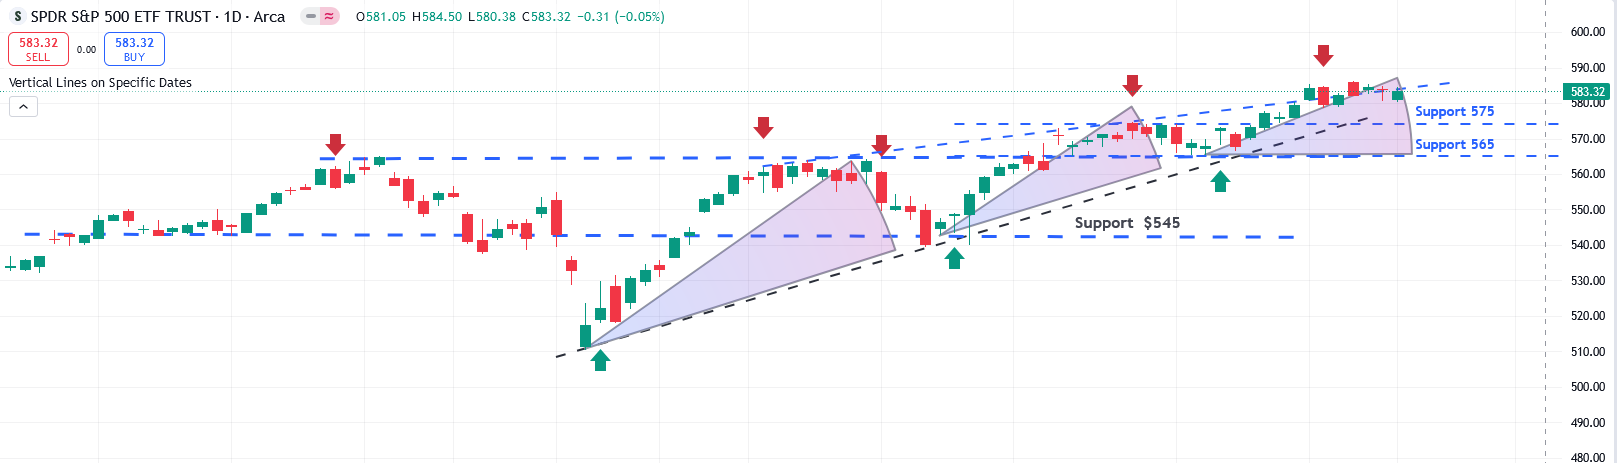
- SPY (S&P 500 ETF):In the last two days, the market started with a dip but was bought up. The 10-year Treasury yield closed above 4.2%, adding pressure on equities. Additionally, the VIX closed at 18.2, remaining stubborn and signaling continued uneasiness. Technically, the ADX is declining, while TLT and SPY are diverging—factors that could act as resistance to upward momentum. So far, S&P companies have reported collective earnings growth of 5% year-over-year, so there is no fundamental reason for the market to rise, other than liquidity. The elliptical pattern suggests a similar technical setup occurred recently in July.
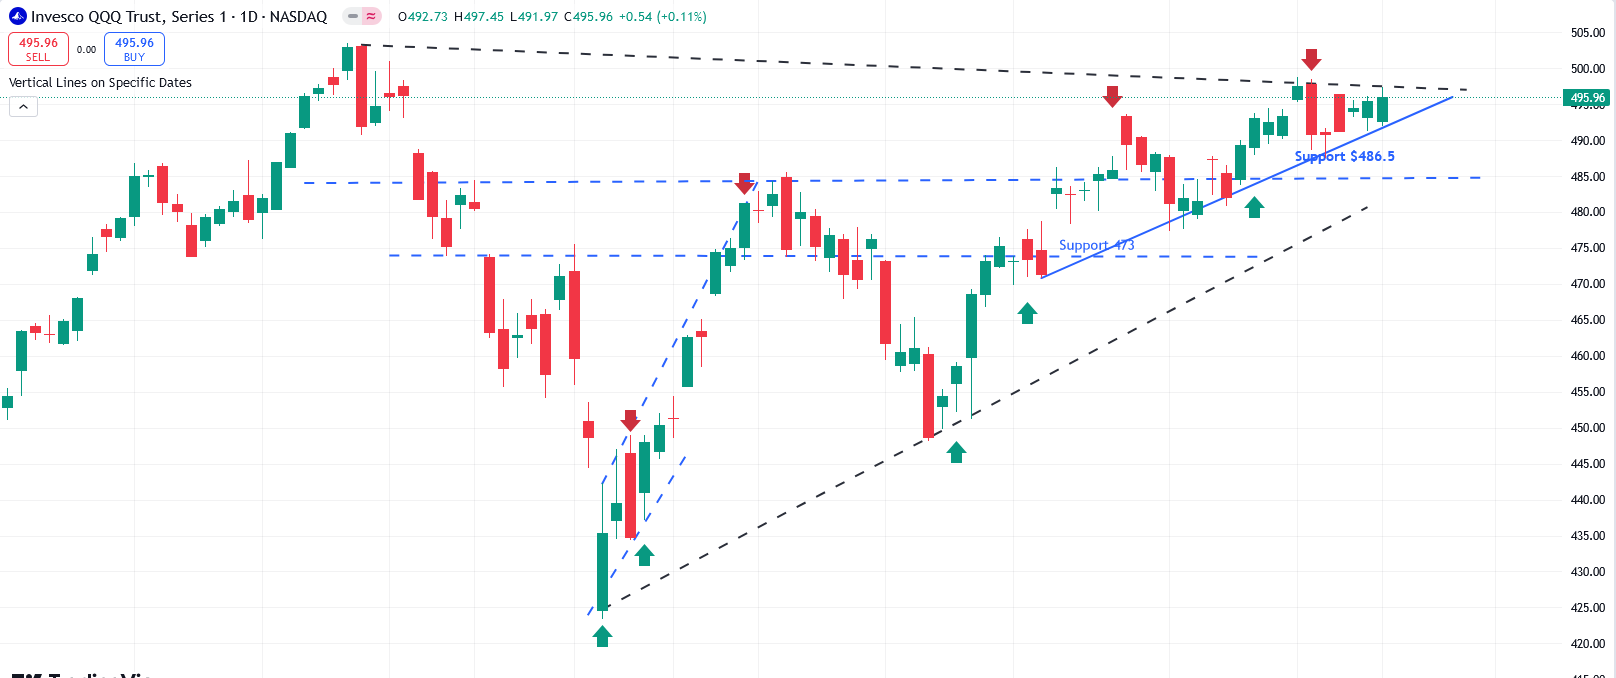
- QQQ (Nasdaq 100 ETF):Similar to SPY, QQQ started with a dip but is getting bought. NVDA and TSMC are contributing strength to QQQ, while the rest of the semiconductor stocks are under pressure. Over the next few days, QQQ's movement will largely depend on Nvidia's performance. Any weakness in Nvidia could quickly bring QQQ down. Currently, QQQ is resting on its 10-day moving average, with the ADX declining, indicating slowing momentum. The only company we currently favor in QQQ is META, which continues to exhibit upward momentum
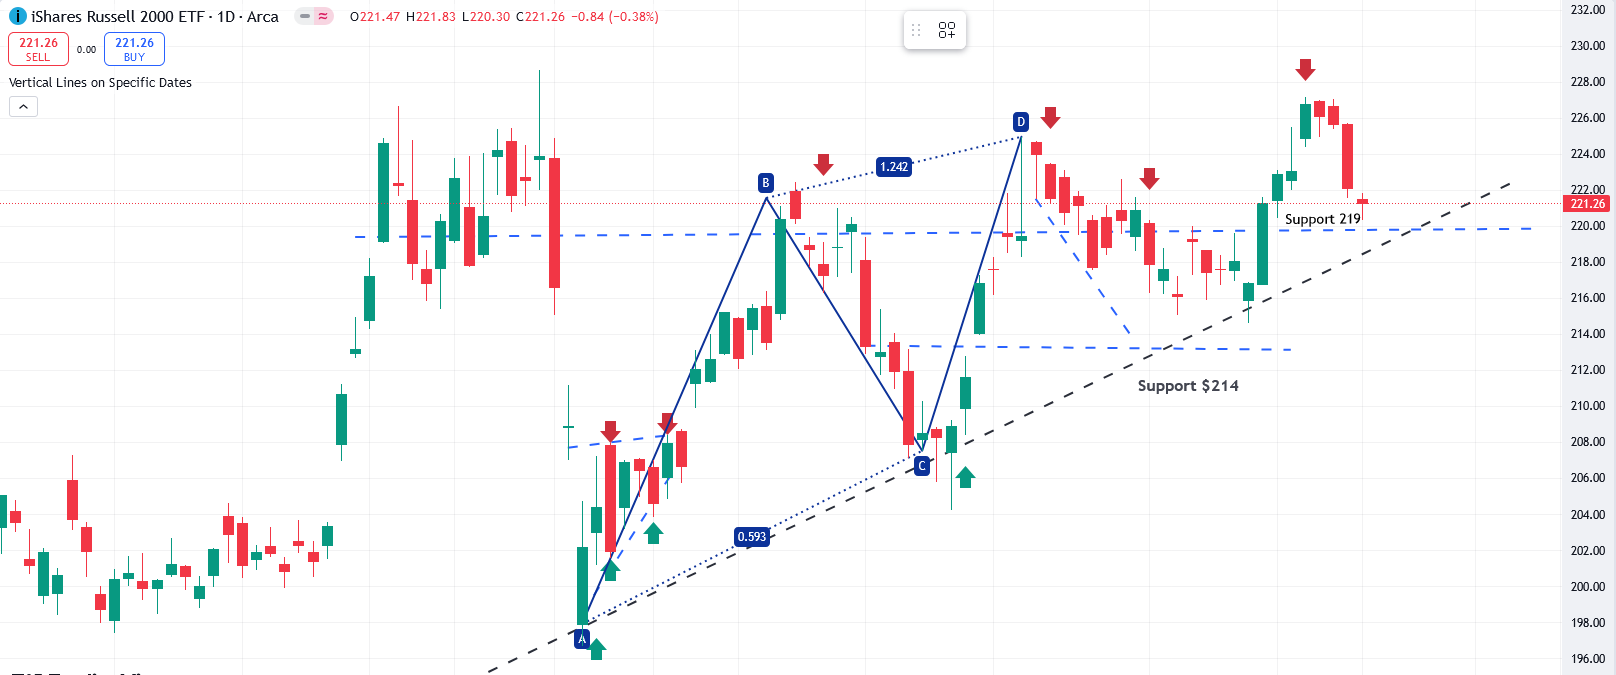
- IWM (Russell 2000 ETF): Small caps are showing real weakness compared to SPY, down more than 2% since last Friday. As noted earlier, regional banks have begun reporting, which could lead to swings in both directions, given that regional banks make up nearly 10% of IWM. There is strong support around 218, and we expect consolidation at this level before any potential rally resumes.
Action Plan for the Week
Looking ahead, the focus will shift to key earnings reports from TSLA and ServiceNow on Wednesday, which could influence tech sentiment. We remain cautious, particularly in sectors like semiconductors and financials, while maintaining a bullish stance on consumer discretionary stocks such as Chipotle (CMG), as well as commodities like gold (GLD) and real estate (IYR), both of which have shown signs of strength..
Featured Trade Ideas
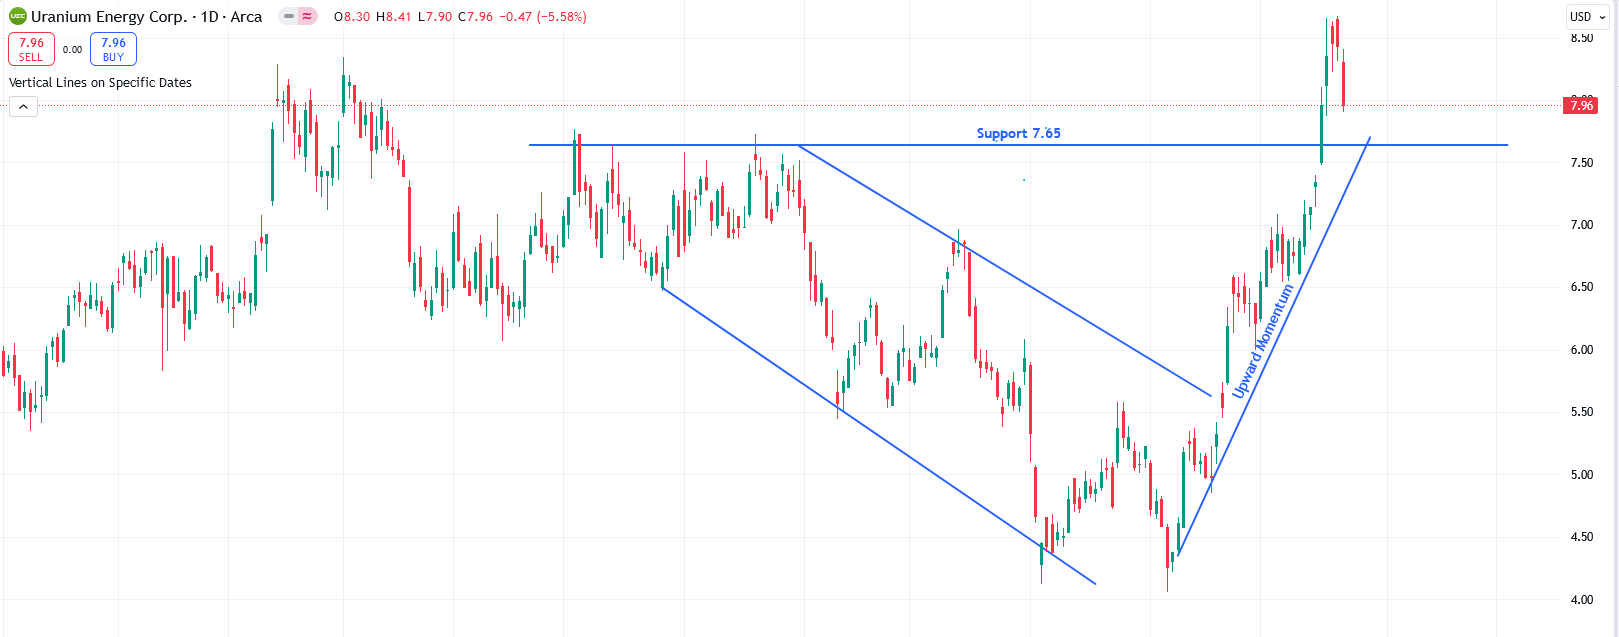
- UEC: As we mentioned earlier, it has corrected slightly, and one could enter if it reaches the 7.6 to 7.75 range, which provides strong support. The long-term trend remains bullish. Uranium continues to show strength, breaking out from its base with a strong ADX and an RSI in the bullish zone. UEC is gaining momentum due to increased power demand from GPU data centers for companies like Google and Meta
🔥 Featured Trade Idea: META 🔥
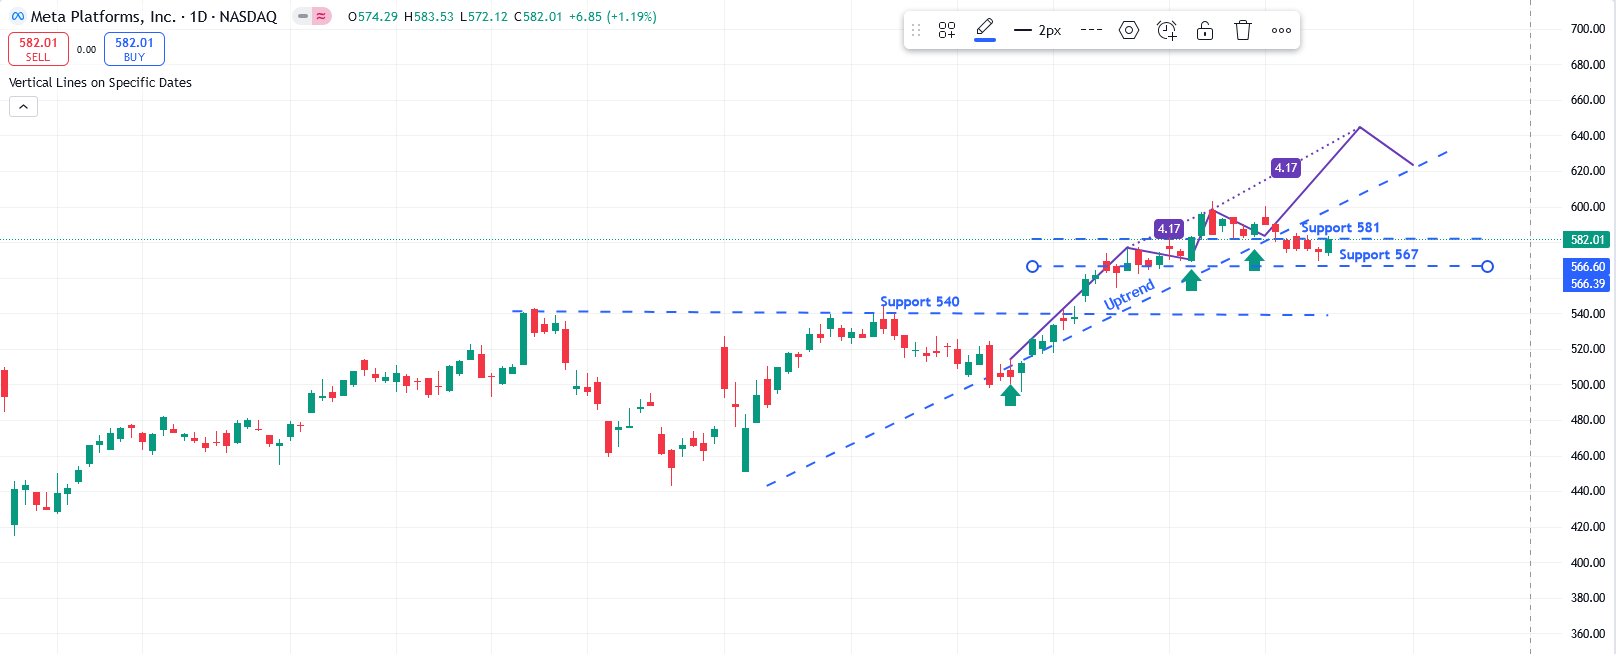
Rationale: It is hovering near its all-time high, and momentum remains strong. Technically, the stock is in a neutral zone, but any dip near $570 to $575 should be viewed as a buying opportunity. It is one of the stocks likely to benefit from a post-election swing rally and is set to report earnings next week. Currently, it is holding support around $581, with strong support near $567. Momentum remains strong, the ADX is positive, indicating a potential breakout in the short term, and resistance is near $605.
💡 Trading Tip of the Week: "Using Support and Resistance Levels" for Better Trade Decisions 💡
Strategy: Understanding and utilizing support and resistance levels is essential for making informed trading decisions. Support levels indicate where a stock has historically had difficulty falling below, while resistance levels show where it has struggled to rise above. Use these levels to inform your entry and exit points. Consider entering a trade near support levels with a tight stop loss just below, as this can provide a favorable risk-to-reward ratio. Conversely, consider taking profits or placing stop losses near resistance levels, as the price may struggle to break through. This strategy can help you navigate market fluctuations and improve overall trade management.