Hello! We’re excited to bring you this week’s top trade ideas and market insights. Stay ahead with OptionEdge.ai! 🚀
Welcome to Your Weekly Edge 🎯
Weekend Update on Trading Insights and Opportunities
By OptionEdge.ai
Exclusive Premium Content
This is content that only premium members can access.
Market Recap
For the week ending October 18, 2024, the market once again displayed remarkable resilience, closing at a new all-time high. Despite this upward momentum, the CBOE VIX Index, a key measure of market volatility, remained elevated, finishing above 18. Let’s break down the key drivers behind these market dynamics in more detail

- SPY (S&P 500 ETF): The market started the week with a dip, largely driven by geopolitical tensions. However, it gradually recovered as the week progressed, closing up 0.86% from the prior week. Most investment banks' earnings reports showed strength in lending growth, robust M&A activity, and improvements in loss provisions. However, those results masked weaknesses in fixed-income trading and staggering unrealized losses in securities held. Due to the Fed's easing path, those unrealized losses appeared less risky, but upcoming job numbers and inflation data could change the outlook, potentially prompting the Fed to pause rate hikes again, which could negatively impact financials. However, this will likely become clearer after the election. The market's calmness is unusual for October, a month that typically sees turbulence. Nevertheless, with two more weeks left in October, we are not out of the woods yet.
- Looking Ahead: While the broader market appears calm, we’ve noticed divergence in correlated markets like India and other emerging markets. Despite the market being at an all-time high, the VIX remains stubbornly elevated. we are bearish on SPY and it is expected to retest 579 and 575 in coming days. The 10-year yield closed near 4.08%, and the 30-year fixed mortgage rate is hovering around 6.44%. All of this signals potential market instability, although ample liquidity from the Fed continues to provide a strong tailwind. On the macroeconomic front, concerns persist: inflation is not cooling fast enough, auto sales are struggling, industrial inventories are rising, and premiums for auto and health insurance, along with food prices, continue to climb. Overall, we are bearish on SPY for the next 10 days and wouldn’t be surprised to see the market decline by 2% next week and by 8-10% over the next 30 days. Hedging your long positions could be beneficial if turbulence increases ahead of the election. The key risks to watch are political drama leading up to the election and sudden policy announcements as last-ditch efforts to sway swing state voters.
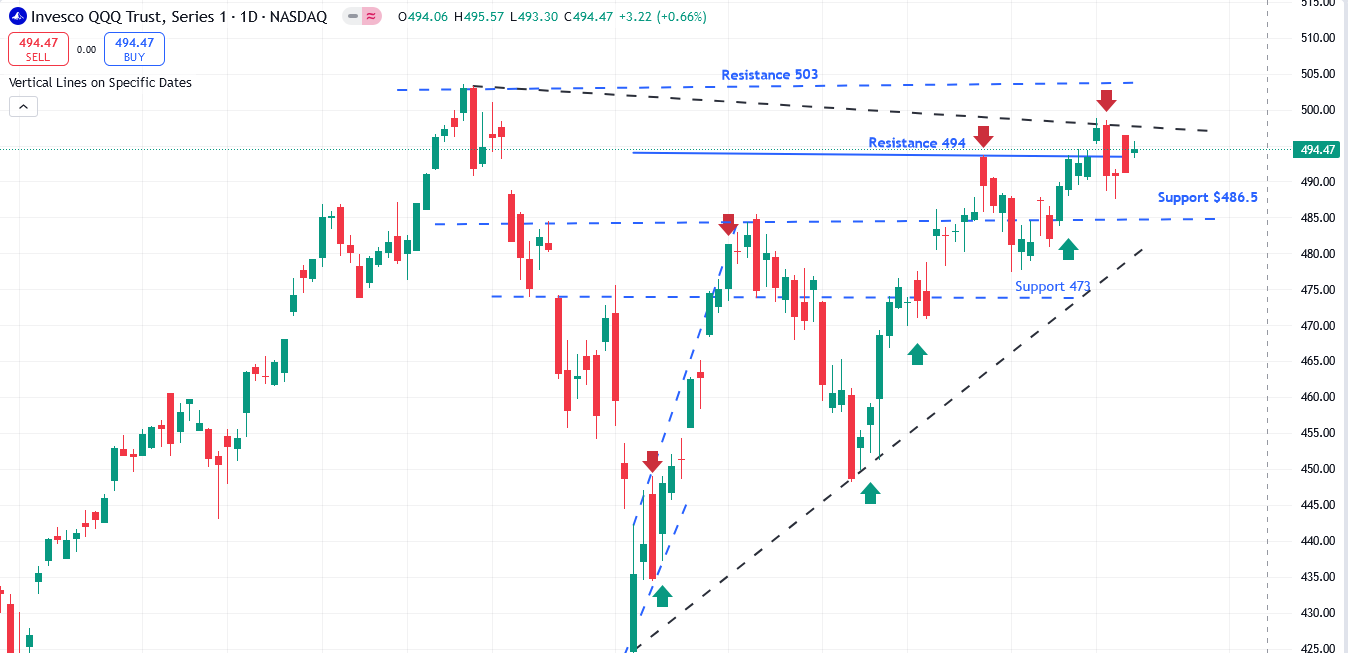
- QQQ (Nasdaq 100 ETF): Similar to SPY, QQQ started the week on a downtrend but managed to recover, closing 0.22% higher than the prior week. However, it has yet to reclaim its all-time high (ATH) from July. Earnings reports from Netflix (NFLX) and TSMC (Taiwan Semiconductor) failed to uplift the tech sector. Big Tech stocks are priced for perfection, and any slight miss or signs of slowed growth could negatively impact performance. Aside from a few companies like MSFT, META, and AAPL, we are bearish on the tech sector for the coming week. From an earnings perspective, key players like TSLA and ServiceNow (NOW) will be reporting on Wednesday. While we remain bullish on TSLA for a post-earnings swing rally, we are slightly cautious in the near term due to its high capital expenditure.
- Looking Ahead: QQQ closed near its previous week's level, failing to break through the 494 resistance area—a bearish signal. We expect a pullback next week, with a likely retest of support near 485 and 478. Key earnings from NFLX and TSMC last week did little to ignite a tech rally, adding to the overall cautious sentiment. Additionally, corporate buyback activity is in a blackout period until earnings season concludes, limiting potential support for tech stocks. Combined with the broader headwinds mentioned for SPY—such as geopolitical tensions, rising interest rates, and inflation concerns—we anticipate further pressure on tech stocks. As investors remain cautious ahead of key earnings reports from companies like TSLA and ServiceNow, it’s likely that tech could continue to face selling pressure in the coming week.
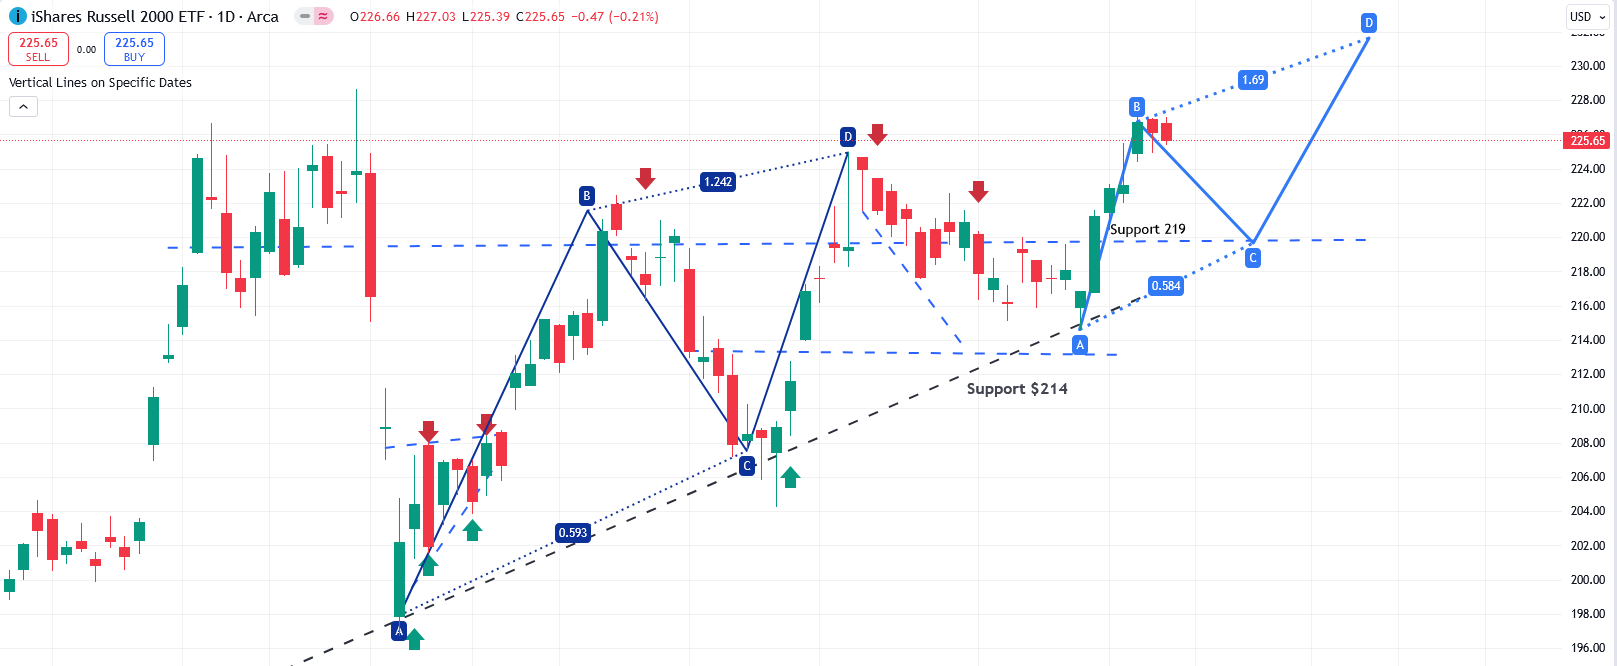
- IWM (Russell 2000 ETF): In contrast to the large-cap indices, IWM rose nearly 2% from the prior week’s close, with most of the gains driven by regional banks, which make up around 10% of IWM. Over the last three months, the technicals have followed an ABCD pattern. If this pattern continues, IWM is likely to retrace to the 219 level to complete step C before resuming its uptrend. The strong performance of regional banks could provide continued support, but any negative surprises from the upcoming economic data or regional bank earnings could trigger a pullback in IWM.
- Looking Ahead: IWM closed near its resistance at 226. If it fails to break out above 226 in the next few days, this level could act as a double-top resistance, likely causing a pullback to 219 before attempting to regain momentum. Given our bearish outlook on the broader market, particularly SPY, and IWM’s high correlation with SPY, we anticipate that small-cap stocks will also face downward pressure. Without a strong catalyst, IWM may struggle to maintain its recent gains.
In summary, while SPY demonstrated resilience, QQQ was supported by mixed performances from the 'Magnificent 7' group of stocks and recent earnings from NFLX and TSMC, helping the index close the week on a positive note. Meanwhile, IWM rose with optimism surrounding a potential soft landing for the economy. Last week, as highlighted in our AI model's projected prices, SPY reached near 579 on October 15th, QQQ touched 488 on October 16th, and SMH came close to 248. These projections were made last week on our AI Analytics page. Additionally, in our latest weekly insights, GLD began to rise, NFLX closed very positively, and both PSTG and ISRG surpassed our targets.
Interest Rates:
The U.S. 10-year Treasury yield continued its upward trajectory, reaching approximately 4.08%, which may dampen equity sentiment. This rise reflects the market's adjustment to the broader economic outlook. While a potential rate cut by the Federal Reserve could impact shorter-term rates, such as the 2-year Treasury, longer-term yields like the 10-year are more closely linked to market expectations for future economic growth and inflation.
Next Week's Action Plan:
Looking ahead, with just over two weeks until the election, we anticipate heightened political drama and increased volatility. We have previously outlined reasons for caution, as the market is exhibiting high levels of resilience and complacency—conditions that often precede a sharp pullback or a flash correction of up to 3-4%. Stay vigilant, as the potential for sudden market shifts increases in the lead-up to the election. Over the next two weeks, we recommend focusing on defensive plays for long positions, particularly as we expect pullbacks in the technology and financial sectors. Our featured trade ideas for next week reflect these defensive strategies.
Featured Trade Ideas
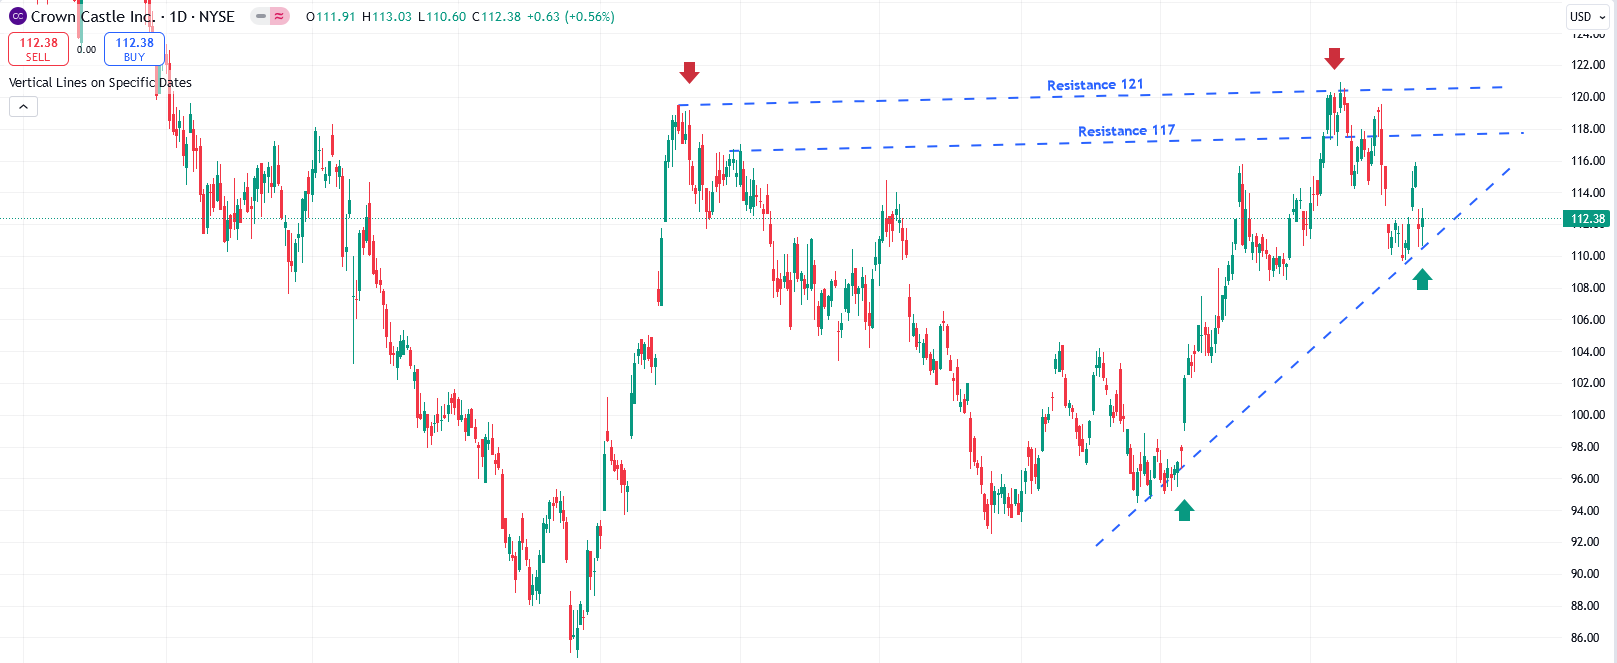
- Crown Castle (CCI): Crown Castle is currently oversold from a technical perspective and is facing resistance at the 50-day moving average (50MA). Stochastics indicate a temporary bottom, suggesting it may attempt to rally toward 117, where it could encounter significant resistance. Crown Castle, a leading provider of communications infrastructure like cell towers and fiber networks, has been impacted by higher interest rates, which typically pressure REITs. However, its long-term growth potential remains tied to the ongoing expansion of 5G infrastructure.
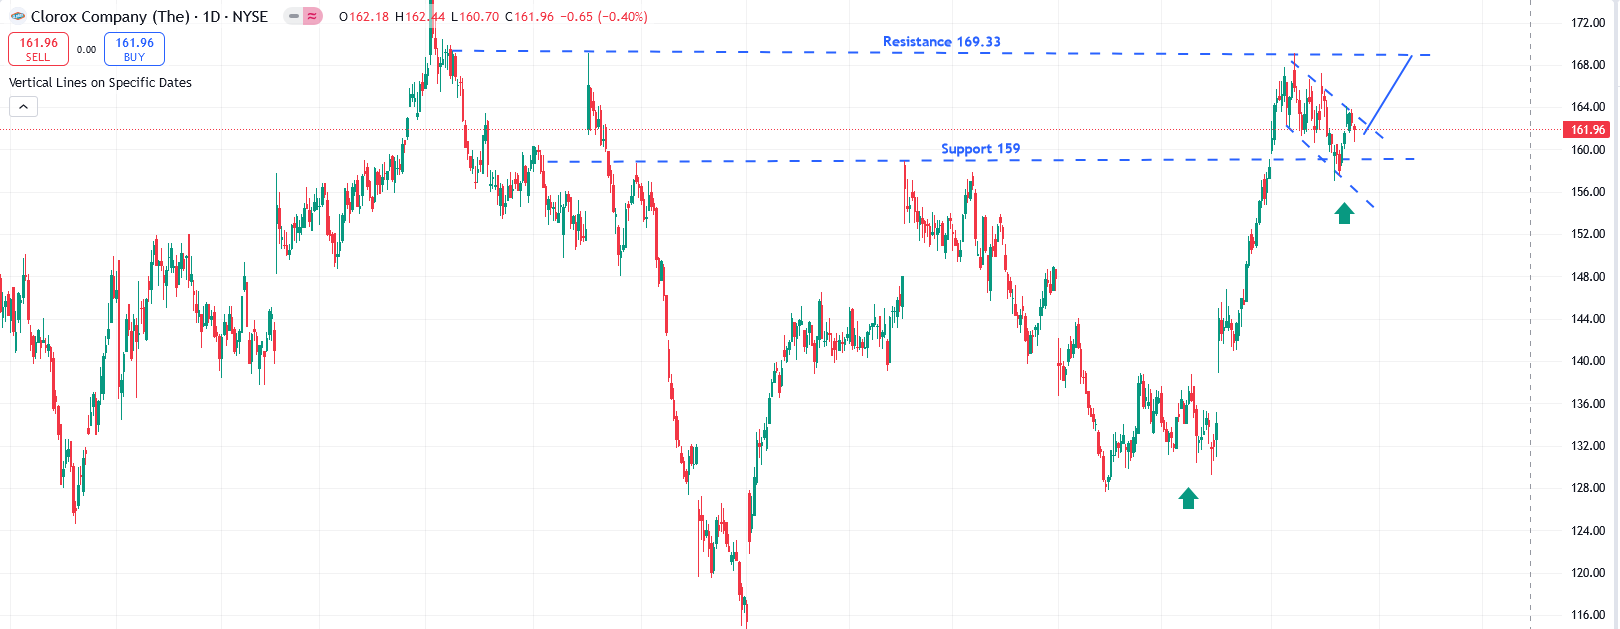
- Clorox (CLX): Clorox is a defensive play for the next two weeks, currently coiling near the 162 area. The technical pattern suggests it may resume upward momentum toward 169. As a leading manufacturer of cleaning and disinfecting products, Clorox has benefited from increased consumer focus on health and hygiene. Additionally, the company has been implementing cost-cutting measures to enhance profitability, positioning itself well in a challenging economic environment.
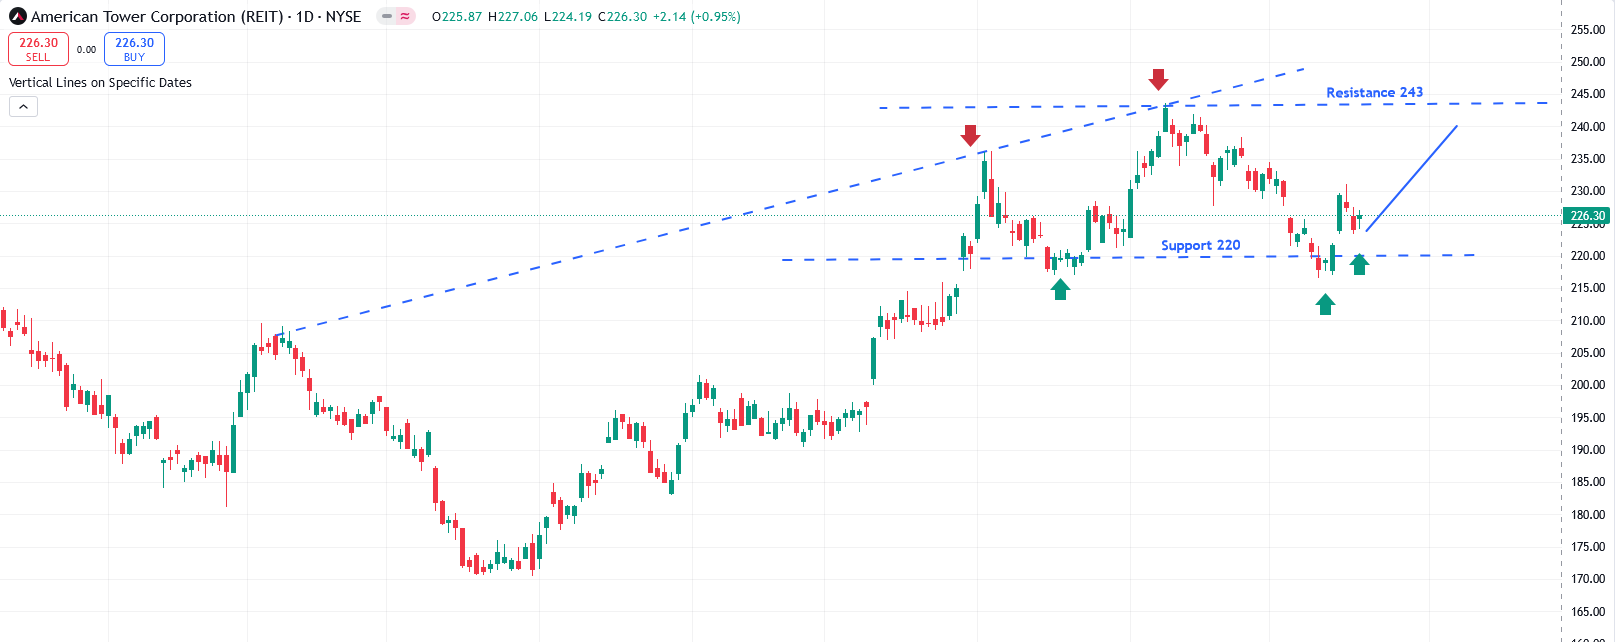
- American Tower (AMT): Technical indicators suggest a potential turnaround toward 232, followed by a move to 243. As a leading global REIT specializing in wireless and broadcast communications infrastructure, American Tower stands to benefit from the growing demand for mobile data and 5G services. The company's strong leasing agreements and diverse tenant base provide a stable revenue stream, making it a solid investment in the current market landscape.
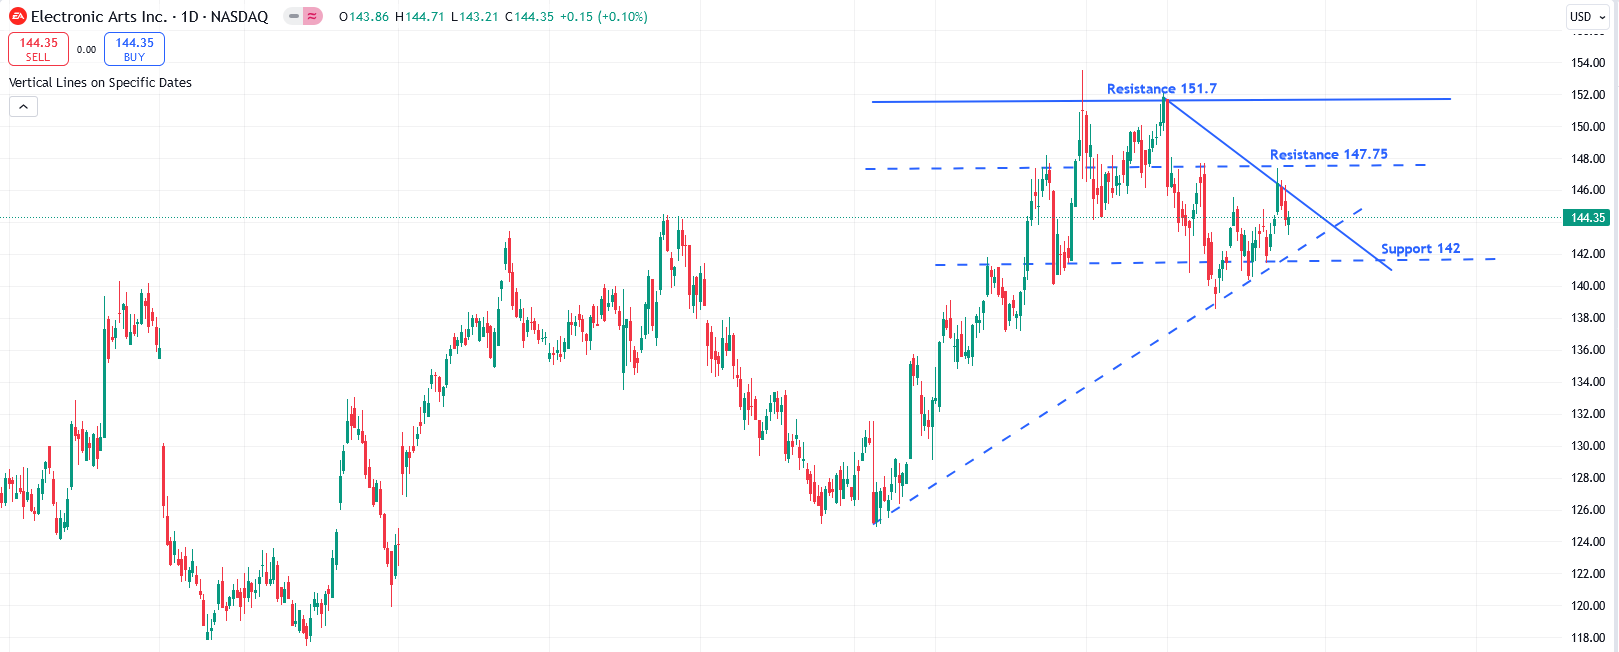
- Electronic Arts (EA): EA is currently facing resistance near the 50-day moving average (50MA), and the upcoming earnings season could act as a catalyst to push the stock above this level, targeting 147. As a leading publisher of video games, EA has a robust portfolio of popular franchises, including FIFA and Madden NFL. Additionally, the company's continued investment in live services and expanding its mobile gaming presence positions it well for future growth amid increasing consumer demand for interactive entertainment.
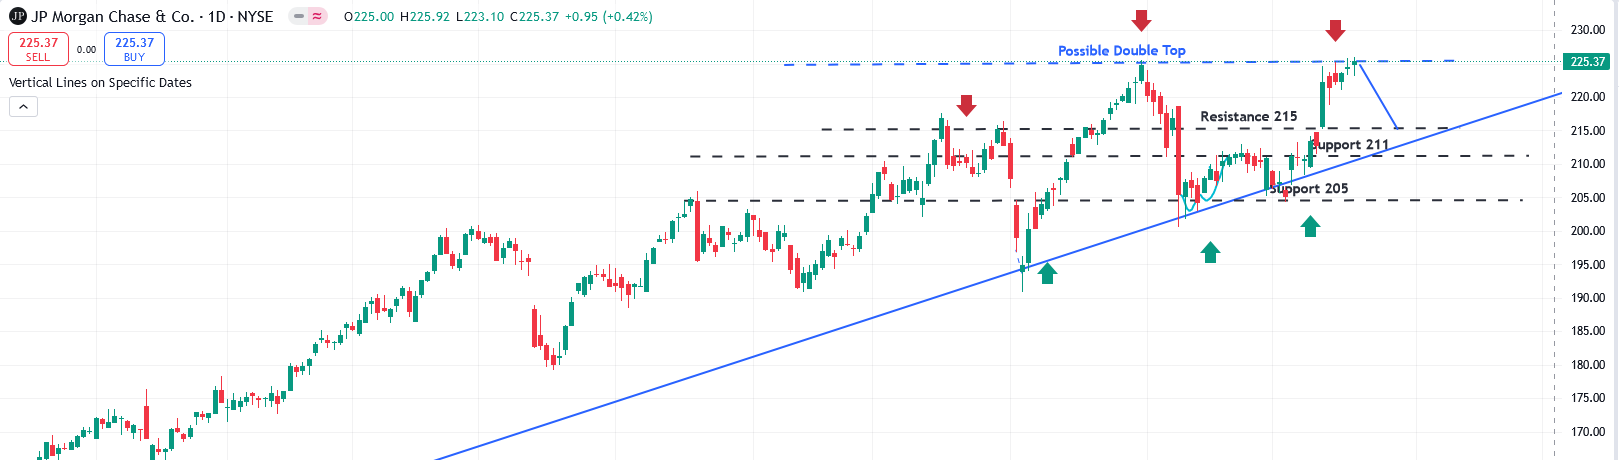
- JPMorgan Chase (JPM): JPMorgan is currently facing double-top resistance and is technically overbought, having risen on thin volume. A correction appears necessary to build momentum, with technical indicators suggesting a potential pullback to the 10-day moving average around 218. As one of the largest and most influential banks in the United States, JPMorgan benefits from its diverse revenue streams, including investment banking, asset management, and consumer services. The company’s strong balance sheet and prudent risk management practices position it well to navigate market fluctuations and capitalize on future growth opportunities.
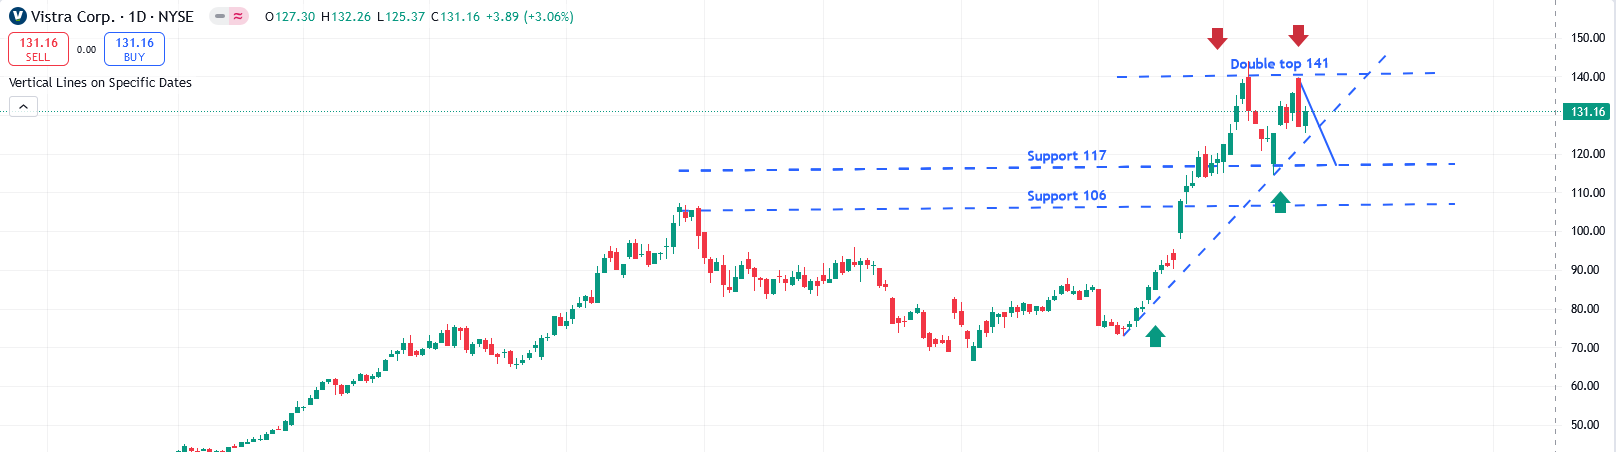
- Vistra Corp (VST):Vistra Corp is a retail electricity and power generation company operating within the Utilities sector. Technically, the stock is forming a double top, indicating a potential pullback to retest the 124 area. As one of the largest energy providers in the U.S., Vistra focuses on delivering reliable and affordable electricity to consumers while also investing in renewable energy sources.
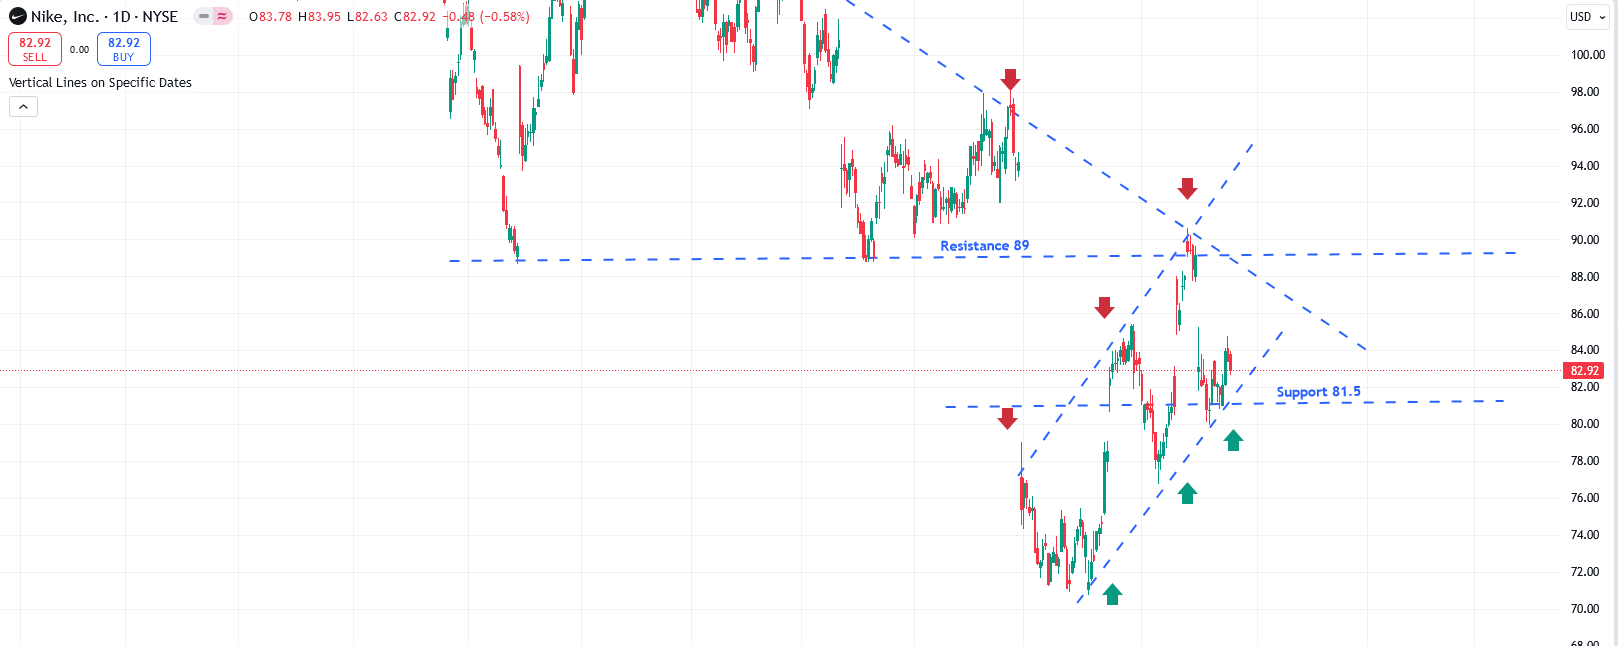
- Nike (NKE): Nike is currently technically oversold and is forming an island bottom pattern. An oversold bounce is expected, potentially allowing the stock to reach near 85. As a global leader in athletic footwear and apparel, Nike continues to innovate and expand its product offerings, capitalizing on trends in health and fitness. The company's strong brand loyalty and strategic marketing initiatives position it well for recovery, especially as consumer spending on athleisure and performance gear remains robust.
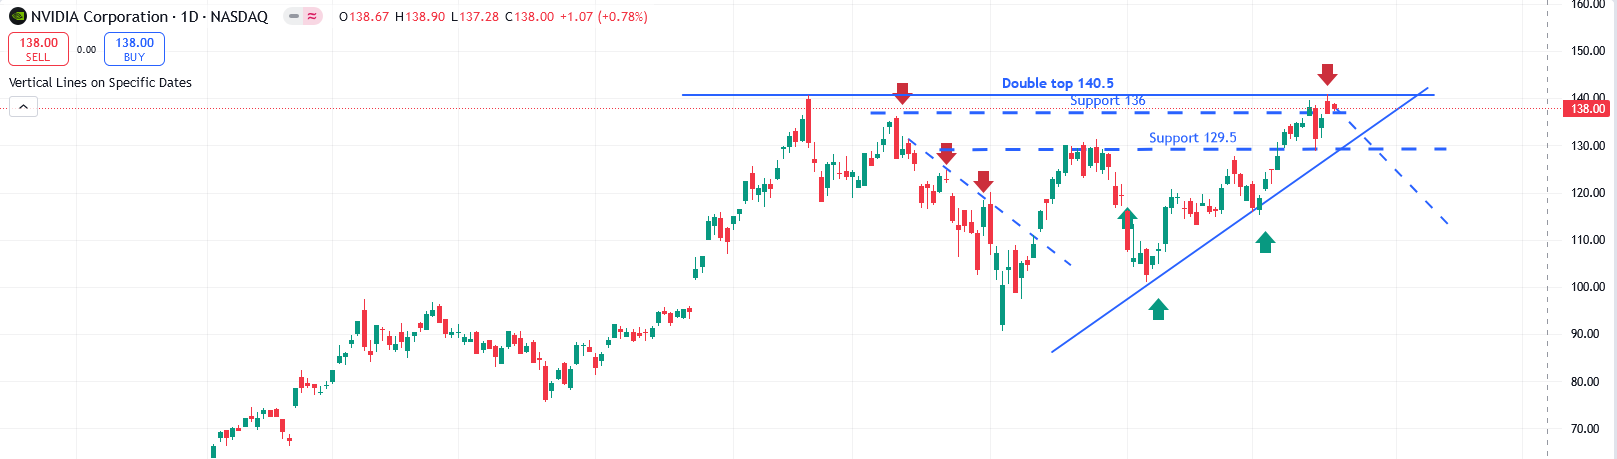
- NVIDIA (NVDA): NVIDIA is currently rising on thin volume, indicating a potential lack of buying strength. While we remain bullish on NVDA for the long term, short-term indicators suggest some indigestion near 138, with a likely correction to 134 (the 10-day moving average) and possibly down to 130. Technical indicators appear stretched, signaling that a pullback could be necessary to reset momentum. As a leader in graphics processing units (GPUs) and artificial intelligence technologies, NVIDIA's innovative products continue to drive significant growth, positioning the company well to capitalize on the increasing demand for high-performance computing and AI solutions in various industries.
🔥 Featured Trade Idea: Northrop Grumman 🔥
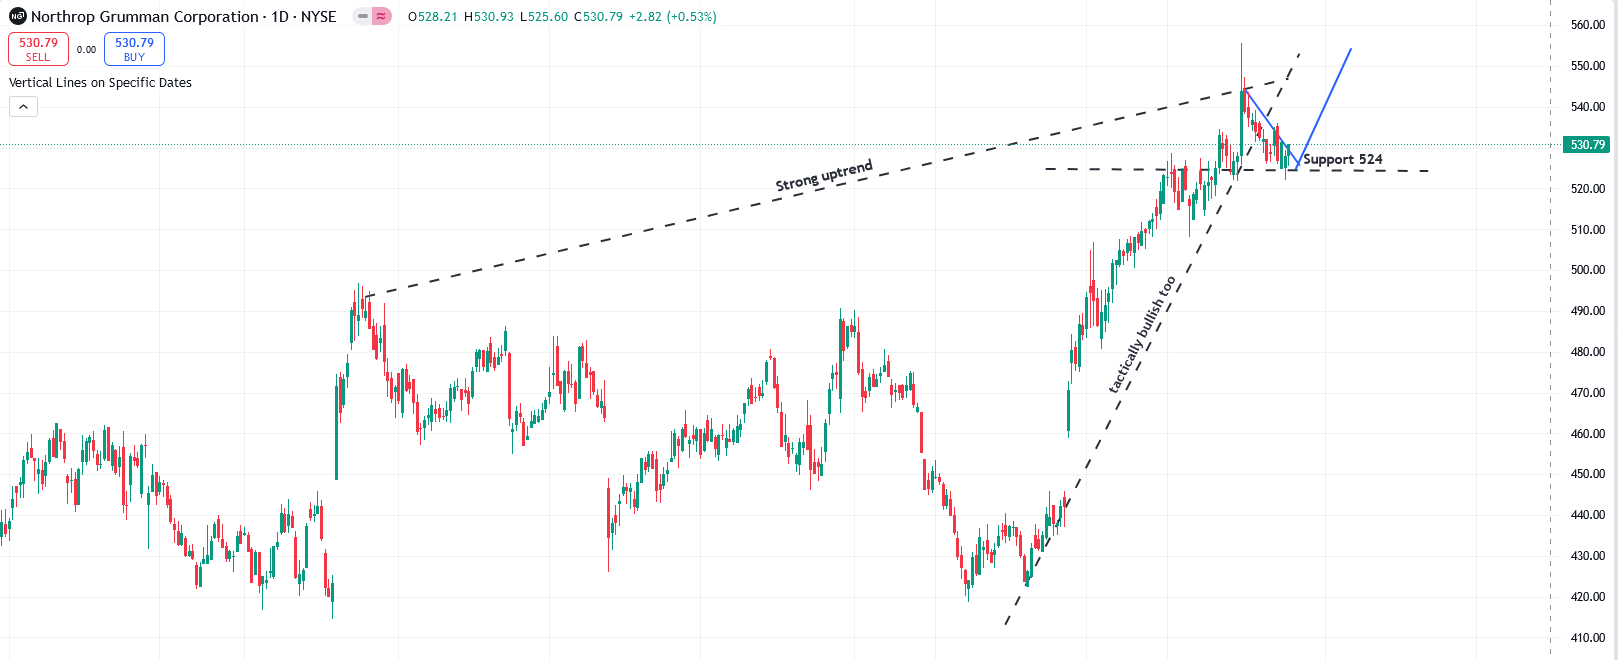
Rationale:Northrop Grumman (NOC): It is coiling near 530, showing signs of upward momentum. Given its association with defense contracts and potential policy shifts, especially in light of previous Trump administration influences, expect some gyration in the coming weeks. This volatility could set the stage for a resumption of the upward trend toward 550. As a leading aerospace and defense contractor, Northrop Grumman is well-positioned to benefit from increased government spending on defense and advanced technology initiatives, bolstering its long-term growth prospects.
💡 Trading Tip of the Week: Maximizing Returns with a "Covered Call" and "Cash-Secured Put" Strategy 💡
Leverage the "Covered Call" strategy to generate additional income from your existing stock holdings. By selling call options on stocks you already own, you can collect premium income. If the stock price remains below the strike price, you retain both the premium and your shares. If the stock price exceeds the strike price, while your shares may be called away, you still profit from the premium and any capital appreciation up to that strike price.
To enhance your income strategy, consider adding a "Cash-Secured Put" approach. This involves selling put options on stocks you are willing to buy at a lower price. By doing this, you can earn premium income upfront while also setting up a potential entry point for purchasing the stock at a discounted price. If the stock price remains above the strike price, you keep the premium; if it falls below, you acquire the stock at an attractive valuation, effectively lowering your cost basis.
In addition, consider incorporating a "Protective Put" strategy. This involves buying put options on stocks you own to hedge against potential downside risk. If the stock price declines, the value of the put option will increase, offsetting some or all of your losses on the stock. This strategy allows you to maintain your long position while protecting your capital from significant downturns.
Combining these strategies can provide a balanced approach to income generation and risk management. By leveraging covered calls and cash-secured puts for income while utilizing protective puts for downside protection, you can capitalize on market movements while maintaining flexibility in your investment strategy.
This research is intended for OptionEdge AI clients only.
OptionEdge AI subscriptions are limited to a single user, and this research must not be shared, redistributed, or disclosed to others. For more information, please contact support@optionedgeai.com.
Conflicts of Interest
This research reflects the views, opinions, and recommendations of OptionEdge AI. At the time of publication, OptionEdge AI has no knowledge of any material conflicts of interest related to this content.
General Disclosures
OptionEdge AI is an independent research firm and is not registered as an investment advisor or broker-dealer under any federal or state securities laws.
This communication is issued by OptionEdge AI for informational and educational purposes only. It is not a personal recommendation, offer, or solicitation to buy or sell any securities, financial products, or services. This material should not be considered legal, tax, accounting, or investment advice. It is not prepared in compliance with legal requirements to promote the independence of investment research and is not subject to any prohibition on dealing ahead of its dissemination.
This document is intended solely for the recipient and may not be distributed without the prior consent of OptionEdge AI.
Copyright © 2024 OptionEdge AI. All rights reserved. No part of this material may be reprinted, sold or redistributed without the prior written consent of OptionEdge AI