Hello! We're excited to bring you this midweek (Wednesday) edition of top trade ideas and market insights. Stay ahead with OptionEdge.ai! 🚀
Welcome to Your Midweek Insights 🎯
Wednesday's Trading Updates and Opportunities
By OptionEdge.ai
Exclusive Premium Content
This content is exclusive to premium members.
Market Recap
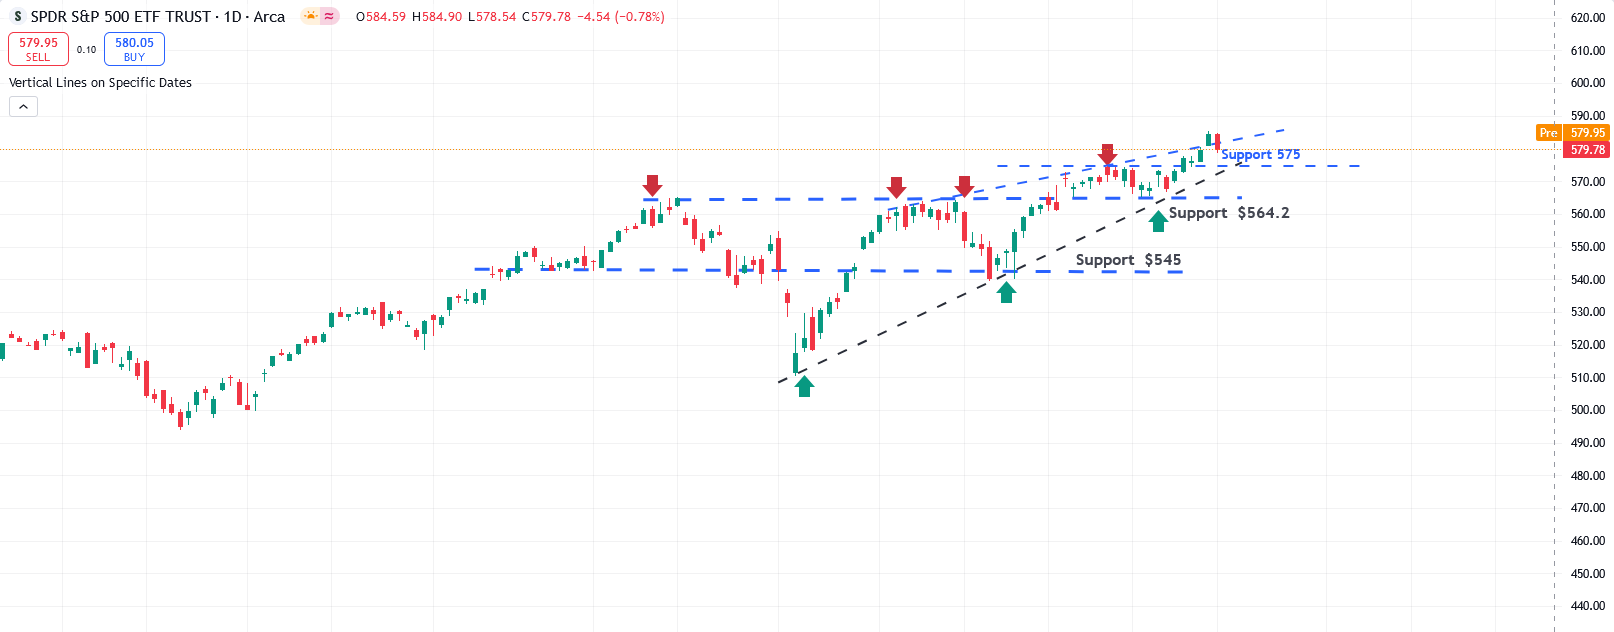
As we anticipated, the market started rising again on the Columbus Day holiday, reaching an all-time high, but then retreated about 1% from that peak. Volatility (VIX) remains elevated at 20. In our view, this level of volatility is typical for October, especially during election years and the earnings season. Historically, the third and fourth weeks of October tend to be risky. Since the market is at an all-time high (ATH), quick profit-taking is important, as a flash correction of up to 4% could occur between now and election day
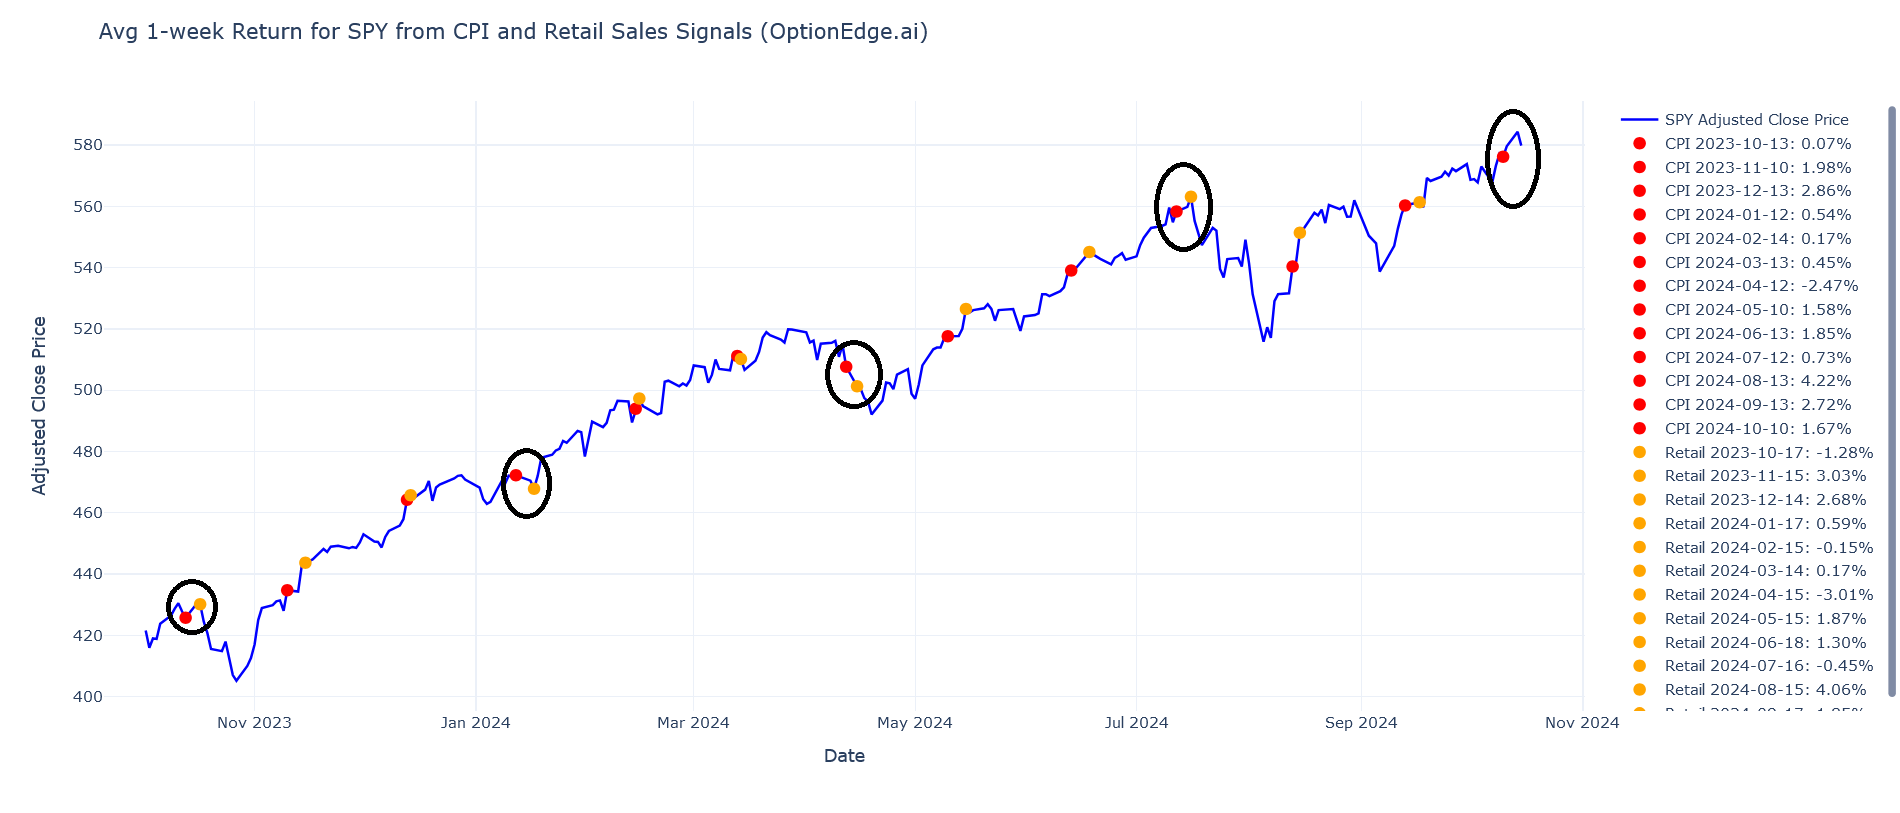
- SPY (S&P 500 ETF):We started the week by reaching an all-time high (ATH). However, on Tuesday, we gave back all the gains and closed almost flat compared to the prior week, indicating an indecisive market. The rapid swings in just two days signal market uncertainty or "indigestion." The 10-year Treasury yield closed above 4%, finishing at 4.01%, which adds pressure on equities. Additionally, the VIX closed at 20.75, and staying above 20 suggests continued risk-off sentiment, creating a headwind for broader market gains. Looking ahead, SPY’s movement will likely hinge on economic data, particularly retail sales updates. With the VIX elevated and interest rates rising, investors should brace for more volatility in the coming weeks.
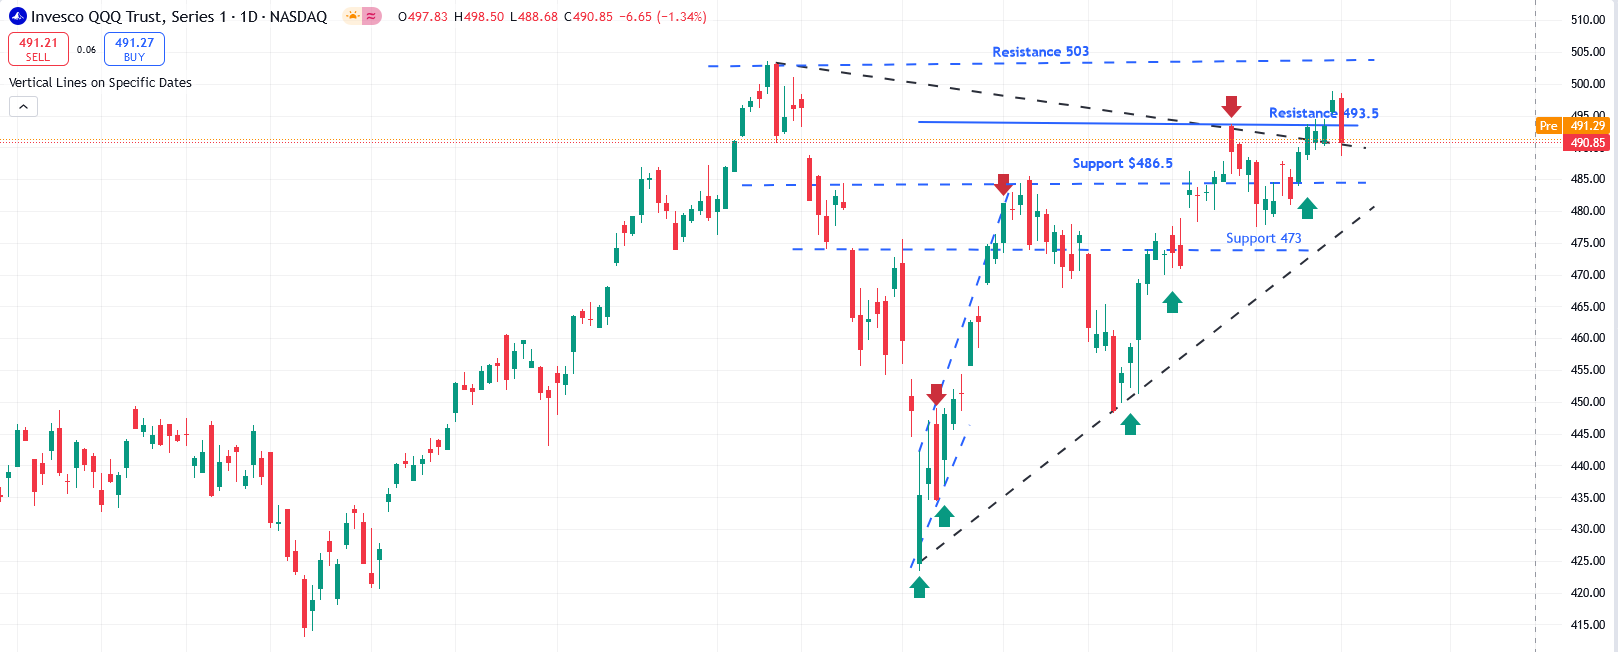
- QQQ (Nasdaq 100 ETF): As we suggested last weekend, the market rose again to 497 on Monday but gave back all those gains on Tuesday. The semiconductor sector sold off due to disappointing earnings from ASML, which also affected the big tech companies. AAPL was almost at its all-time high (ATH) but retraced. AAPL has the best seasonality over the next three weeks; however, we are a bit cautious about any long positions in tech for now. There are rumors that antitrust actions could be taken against AAPL, similar to what happened with Google. If the market corrects by another 1 to 2%, it could present a great opportunity to go long on the Magnificent Seven stocks for a significant rally toward election day.
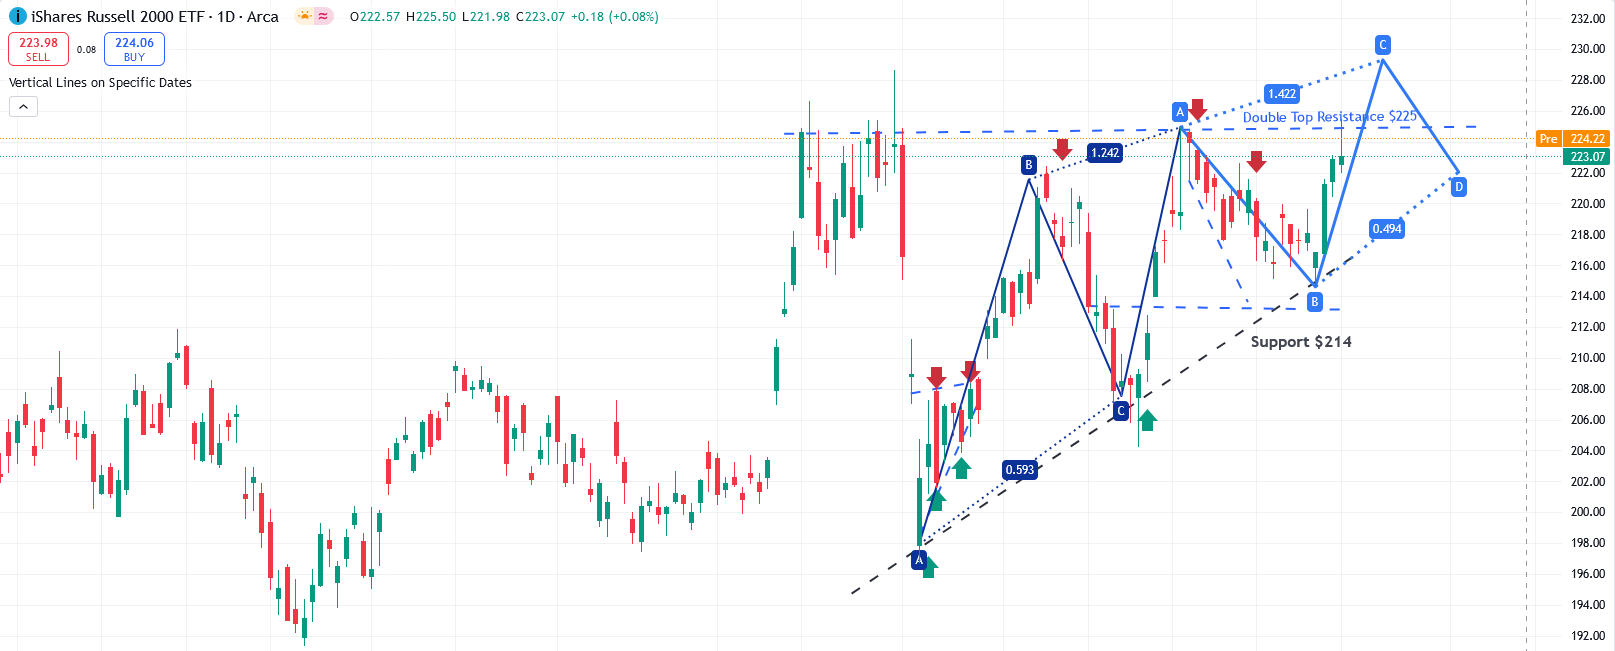
- IWM (Russell 2000 ETF): Small caps are showing resilience against broader market weakness, closing almost 1% higher compared to the prior week. However, as regional banks report earnings this week, we can expect swings in both directions, as regional banks make up nearly 10% of IWM. The upcoming retail sales report is important, and any perceived weakness could impact IWM.
Action Plan for the Week
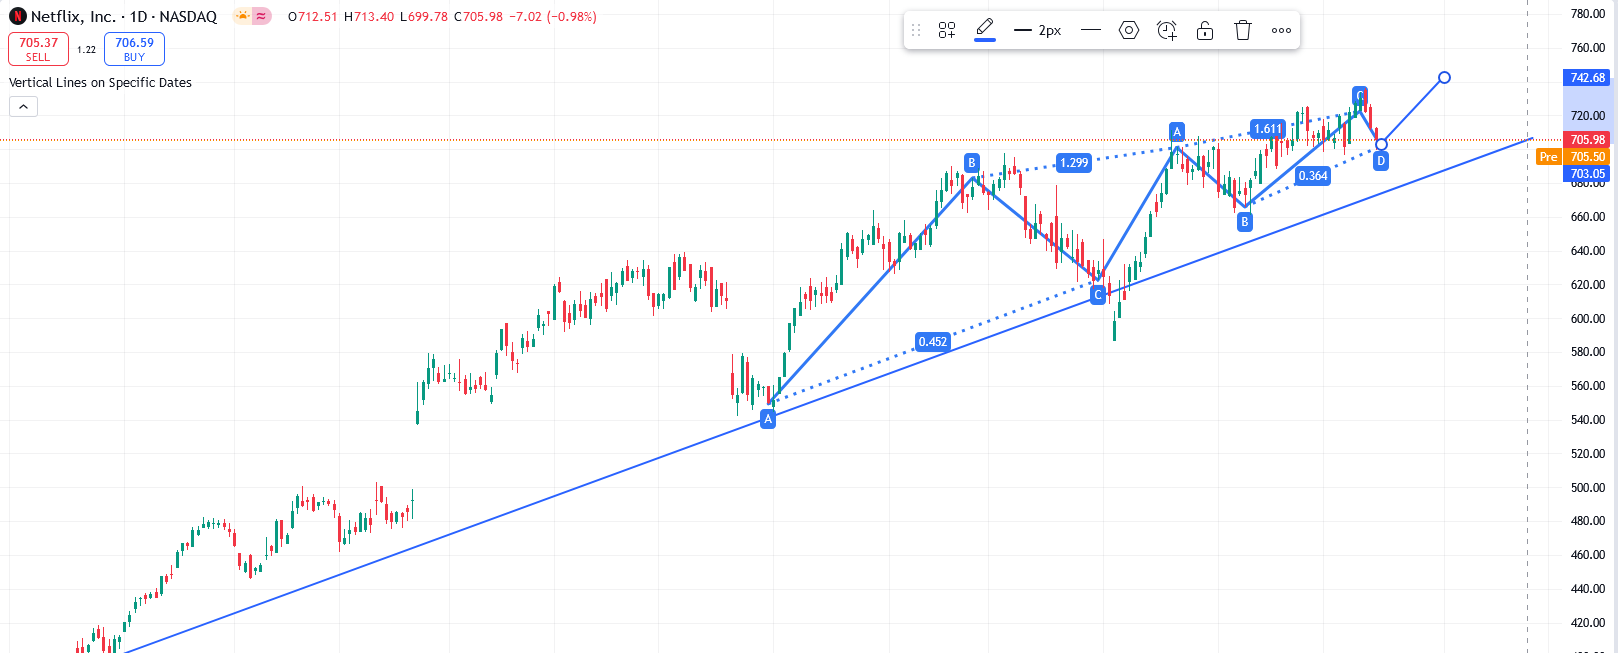
Looking ahead, the focus will shift to the key earnings reports of NFLX and retail sales on Thursday. Both events are likely to be market movers. We remain cautious, especially in sectors like semiconductors and financials, while being bullish on consumer discretionary stocks such as Chipotle (CMG), commodities like gold (GLD), and real estate (IYR), which have shown signs of strength.
AAPL has risen as anticipated, and we successfully closed our call positions. As mentioned in last week's newsletter, the long-term trend for AAPL remains intact, along with META
Featured Trade Ideas
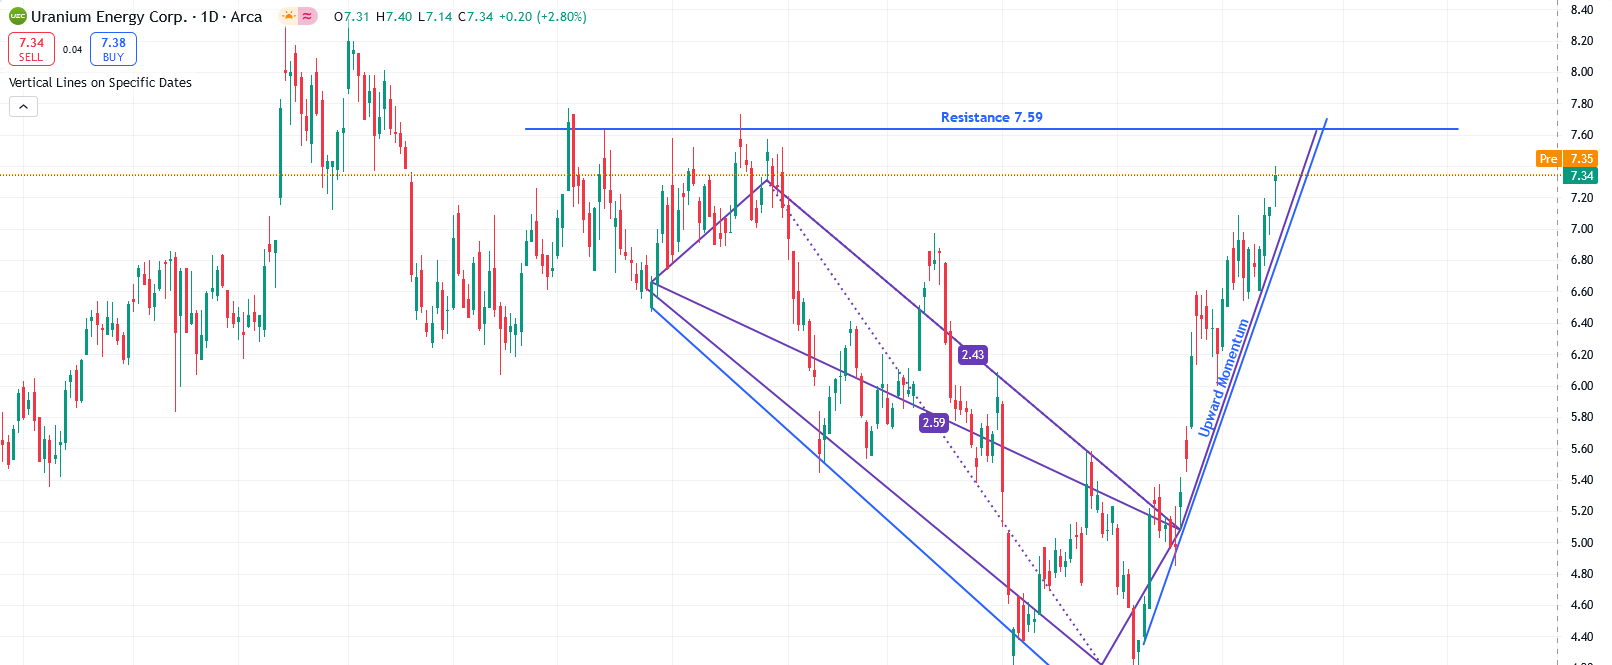
- UEC: Uranium continues to exhibit strength but is encountering resistance near $7.6. However, it is breaking out from its base, and the stochastic indicator is turning bullish. UEC is gaining due to increased power demand from GPU data centers for Google and META.
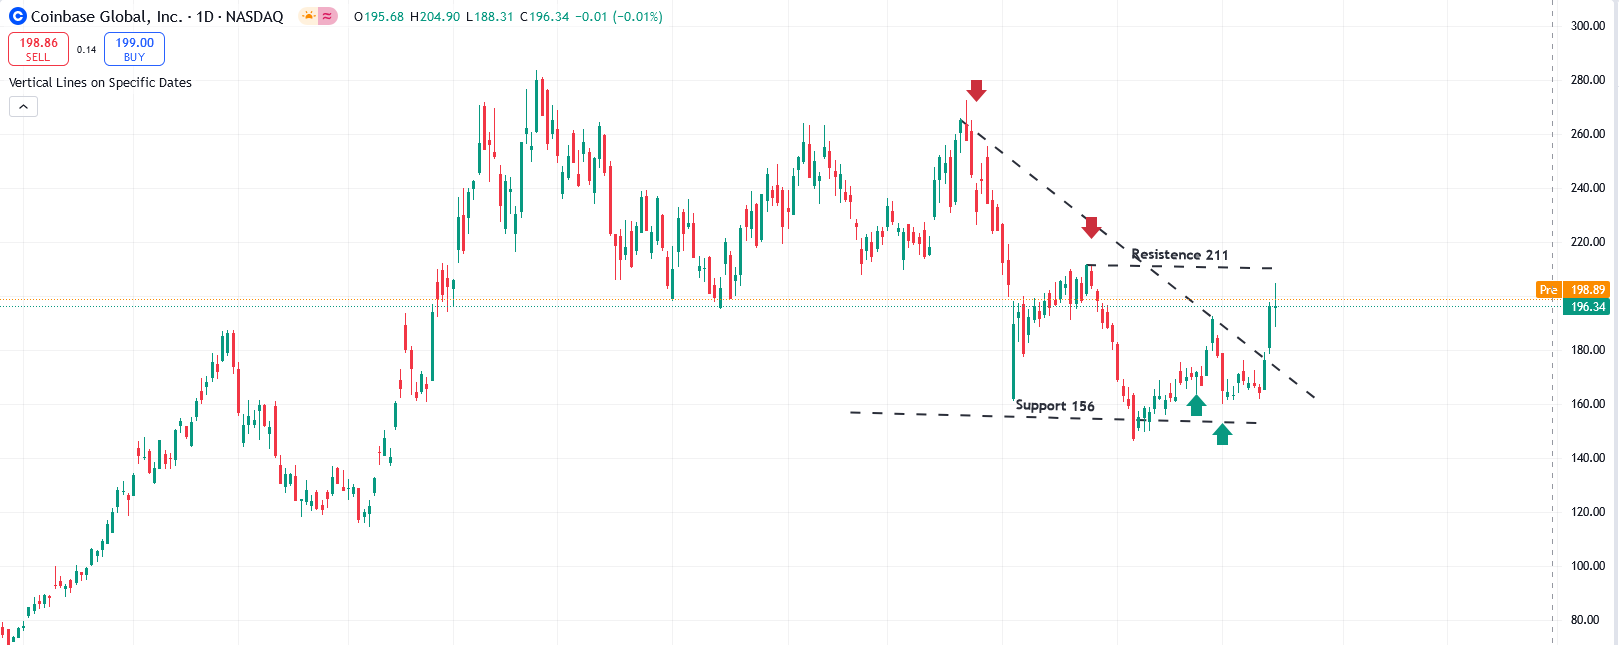
- COIN: As BTC resumes its rally, COIN is catching up. However, it is entering a seasonally unfavorable period, and if it approaches the 205 to 211 range, we can expect a retracement to the 182 area.
🔥 Featured Trade Idea: CAT 🔥
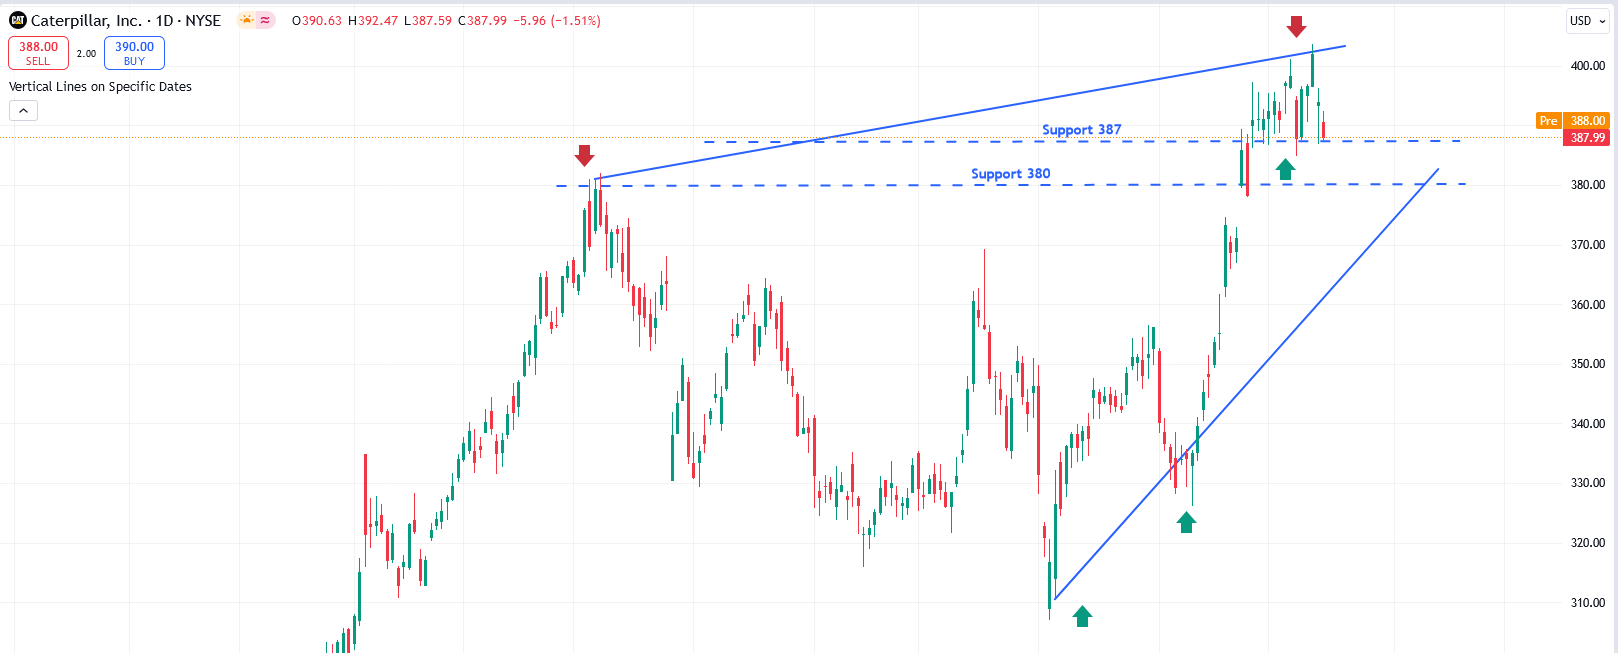
Rationale: Our AI Quant model suggests that Caterpillar (CAT) will resume its uptrend to $410 in the coming weeks, with the potential to test the $380 to $387 support range. Technically, the stock is currently overbought, but any dip near $380 can be viewed as a buying opportunity. As a "Trump trade," Caterpillar is one of the stocks likely to benefit from a post-election swing rally.
💡 Trading Tip of the Week: "Using Support and Resistance Levels" for Better Trade Decisions 💡
Strategy: Understanding and utilizing support and resistance levels is essential for making informed trading decisions. Support levels indicate where a stock has historically had difficulty falling below, while resistance levels show where it has struggled to rise above. Use these levels to inform your entry and exit points. Consider entering a trade near support levels with a tight stop loss just below, as this can provide a favorable risk-to-reward ratio. Conversely, consider taking profits or placing stop losses near resistance levels, as the price may struggle to break through. This strategy can help you navigate market fluctuations and improve overall trade management.