Hello! We’re excited to bring you this week’s top trade ideas and market insights. Stay ahead with OptionEdge.ai! 🚀
Welcome to Your Weekly Edge 🎯
Weekend Update on Trading Insights and Opportunities
By OptionEdge.ai
Exclusive Premium Content
This is content that only premium members can access.
Market Recap
For the week ending October 11, 2024, the market once again displayed remarkable resilience, closing at a new all-time high. Despite this upward momentum, the CBOE VIX Index, a key measure of market volatility, remained elevated, finishing above 20. Let’s break down the key drivers behind these market dynamics in more detail
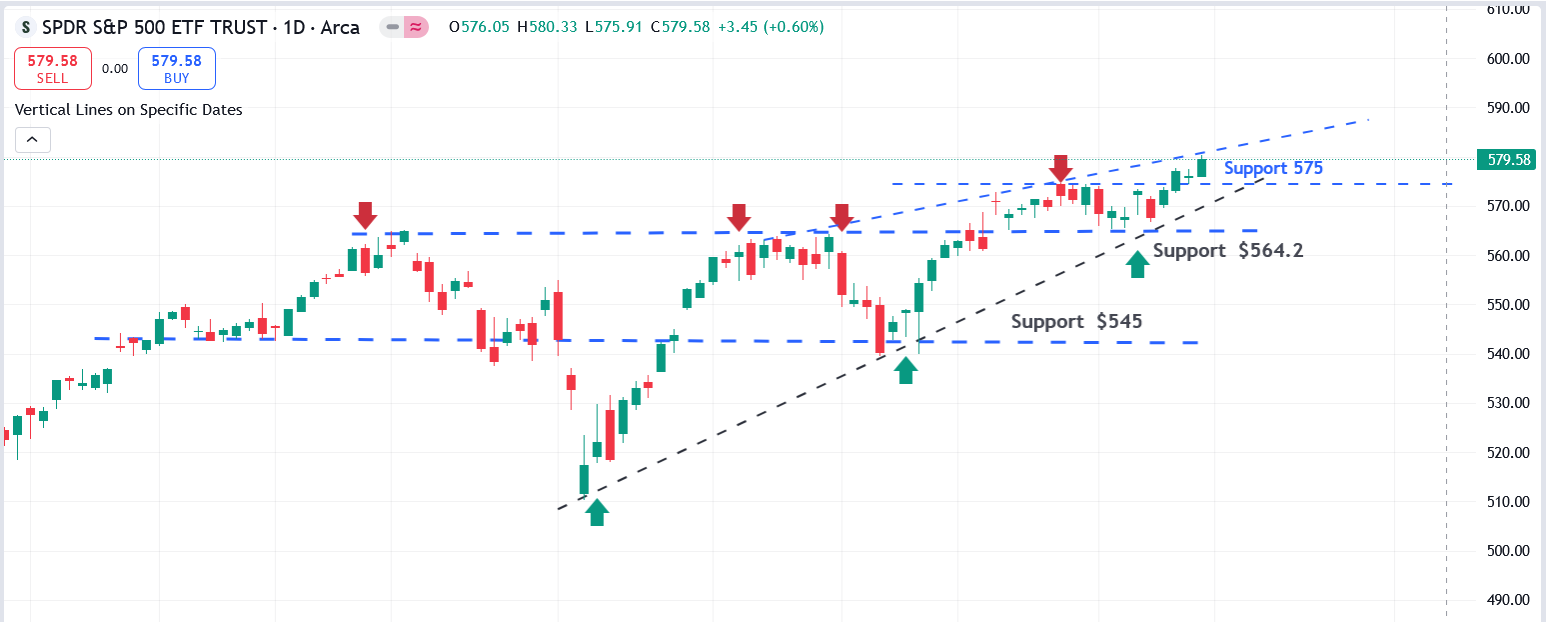
- SPY (S&P 500 ETF): The market began the week with heightened volatility, largely driven by geopolitical tensions. However, it gradually recovered as the week progressed, closing up 1.15% from the prior week. JP Morgan's earnings report showed strength in lending growth, robust investment banking activities in M&A, and improvements in loss provisions. Despite facing cost pressures due to persistent inflation in Q3, the report was seen as a positive indicator for the economy, boosting overall market sentiment. Additionally, Thursday's CPI report raised hopes for a potential 25-basis-point rate cut by the Federal Reserve in November, further fueling market optimism. The Fed’s dovish stance continues to support liquidity, driving the market higher.
- Looking ahead, SPY appears to be breaking out of its trading range between 565 and 575, with expectations of resuming its uptrend. The ETF could push towards the 583–584 range early next week and settle near 579 by the week's end. Although SPY is reaching new all-time highs, the VIX remains stubbornly elevated, suggesting underlying risks. The VIX’s persistent rise above 20 indicates potential market instability, but ample liquidity continues to provide a strong tailwind. On the macroeconomic front, concerns remain: inflation is not cooling, auto sales are declining while inventories are rising, and premiums for auto and health insurance continue to climb alongside food prices. Additionally, credit card delinquency rates are spiking, and rising mortgage rates are expected to dampen housing sales and lending growth.
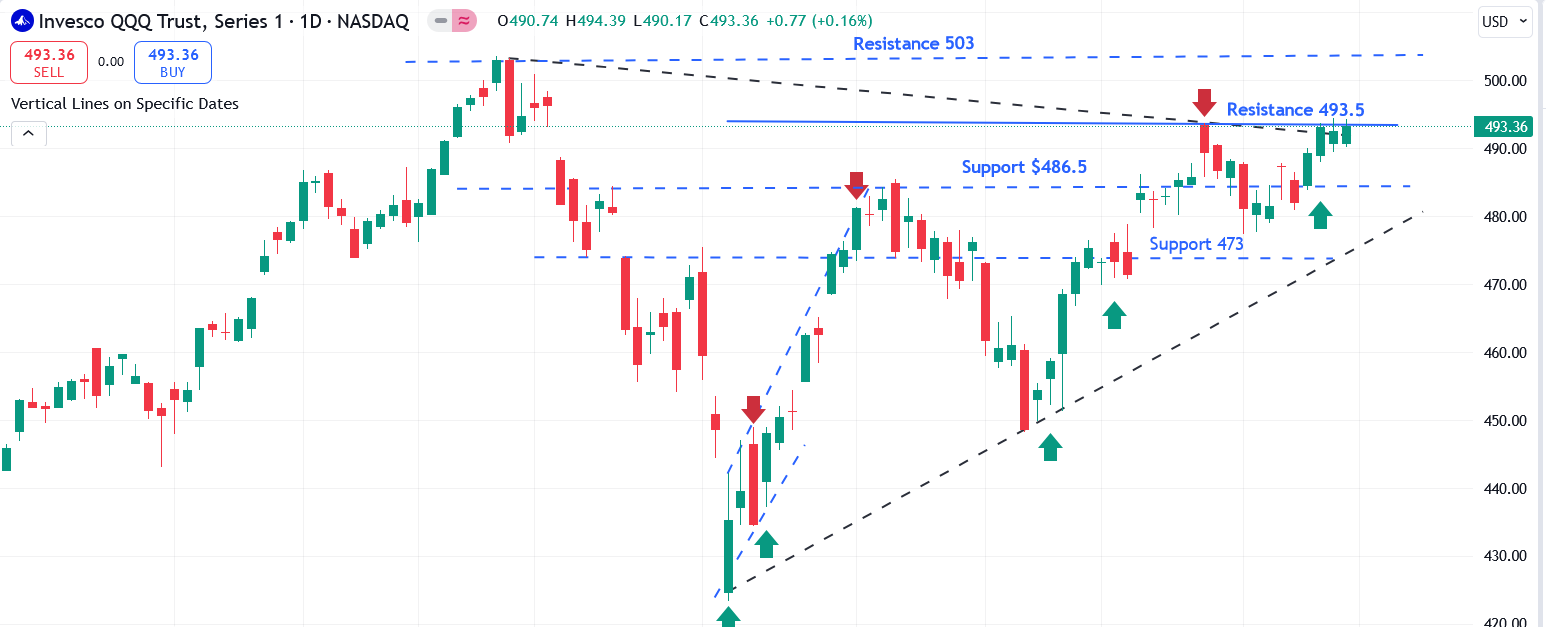
- QQQ (Nasdaq 100 ETF):Similar to SPY, QQQ began the week on a downtrend but managed to recover, closing 1.25% higher than the prior week. However, it has yet to reclaim its all-time high (ATH) reached in July. The upcoming earnings report from Netflix (NFLX) may spark positive sentiment in the tech sector, particularly with streaming growth expectations. Additionally, Taiwan Semiconductor Manufacturing Company (TSMC) is set to report earnings on Thursday, which could provide crucial insights into AI GPU demand, potentially boosting the overall sentiment for semiconductor stocks.
- Looking ahead, QQQ closed near its resistance level of 493 and is expected to resume its uptrend early next week, potentially reaching the 497 level and settling near 494 by week's end. If NFLX and TSMC deliver strong earnings results, QQQ could see a swift rise towards 503. However, the elevated VIX, which remains above 20, poses a potential risk, as heightened volatility could dampen tech sector gains. Moreover, key components like Tesla (TSLA) and Microsoft (MSFT) are currently facing challenges, and their performance will likely continue to influence QQQ's overall sentiment.
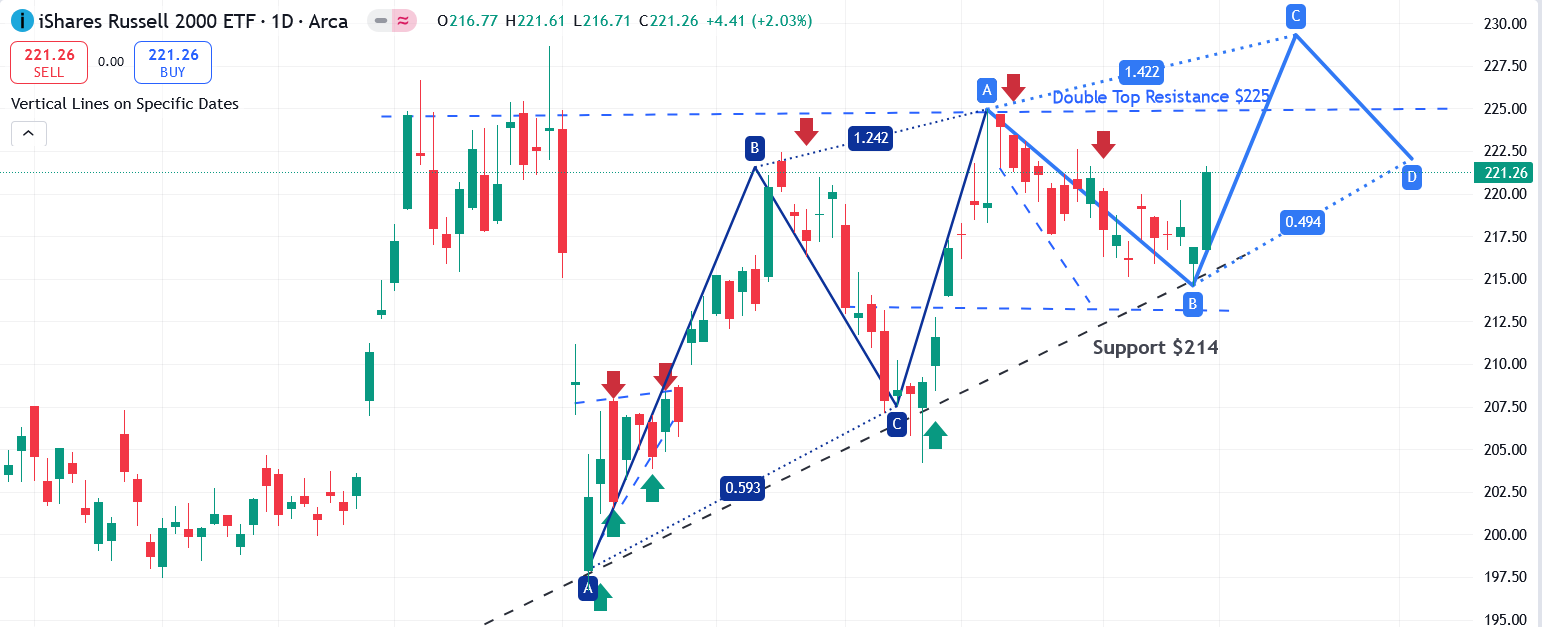
- IWM (Russell 2000 ETF): In contrast to large-cap indices, IWM struggled for most of the week. However, Friday's session saw a turnaround, driven by positive earnings from JPMorgan, which helped boost sentiment among small-cap stocks. IWM closed the week up 1% from the prior week. Notably, about 10% of IWM’s constituents come from regional banks, and their performance is closely tied to lower interest rates and positive outlooks from major financial players like JPMorgan (JPM) and Goldman Sachs (GS).
- Looking ahead, IWM has broken out from a key weekly trendline, signaling potential for further gains. Next week, earnings reports from regional banks and other financial institutions could provide additional momentum for IWM, given its significant exposure to the banking sector.
In summary, while SPY demonstrated resilience, the QQQ was supported by mixed performances from the 'Magnificent 7' group of stocks, which helped the index close the week on a positive note. On the other hand, IWM faced challenges due to ongoing economic pressures. As highlighted in our mid-week insight, Palantir (PLTR) delivered impressive performance. However, our bearish outlook on SPY and IWM, along with our bullish stance on Tesla (TSLA), did not materialize as anticipated.
Interest Rates:
The U.S. 10-year Treasury yield continued its upward trajectory, reaching approximately 4.1%, a level not seen since July. This rise reflects the market's adjustment to the broader economic outlook. While a potential rate cut by the Federal Reserve could influence shorter-term rates, such as the 2-year Treasury, longer-term yields like the 10-year are more closely tied to market expectations for economic growth and inflation.
Mortgage Rates:
Following the upward trend in Treasury yields, mortgage rates have also edged higher. The 30-year fixed mortgage rate is now hovering around 6.64%, a level that could dampen housing market activity and borrowing demand. These higher rates are likely to put additional pressure on homebuyers and could slow down the broader real estate market in the coming months.
Oil Prices:
Oil prices settled above $75 per barrel, driven largely by ongoing geopolitical conflicts in the Middle East. This price increase has significant implications for inflation, as rising energy costs can ripple through various sectors, potentially putting additional pressure on both consumers and the broader market.
Next Week's Action Plan:
Looking ahead, Monday, October 14th is Columbus Day, meaning the bond market will be closed while the stock market remains open. Historically, equity markets tend to rise during bond market holidays. Next week is relatively light on major economic events, with the primary focus being Thursday’s retail sales report and a few speeches from Federal Reserve governors. In the absence of significant economic data, the market is likely to maintain its uptrend, although Friday could see some pullback if the VIX remains elevated above 20. Key earnings reports to watch include financial giants Goldman Sachs (GS) and Morgan Stanley (MS), along with notable releases from Netflix (NFLX) and TSMC on Thursday, which could influence market direction.
Featured Trade Ideas
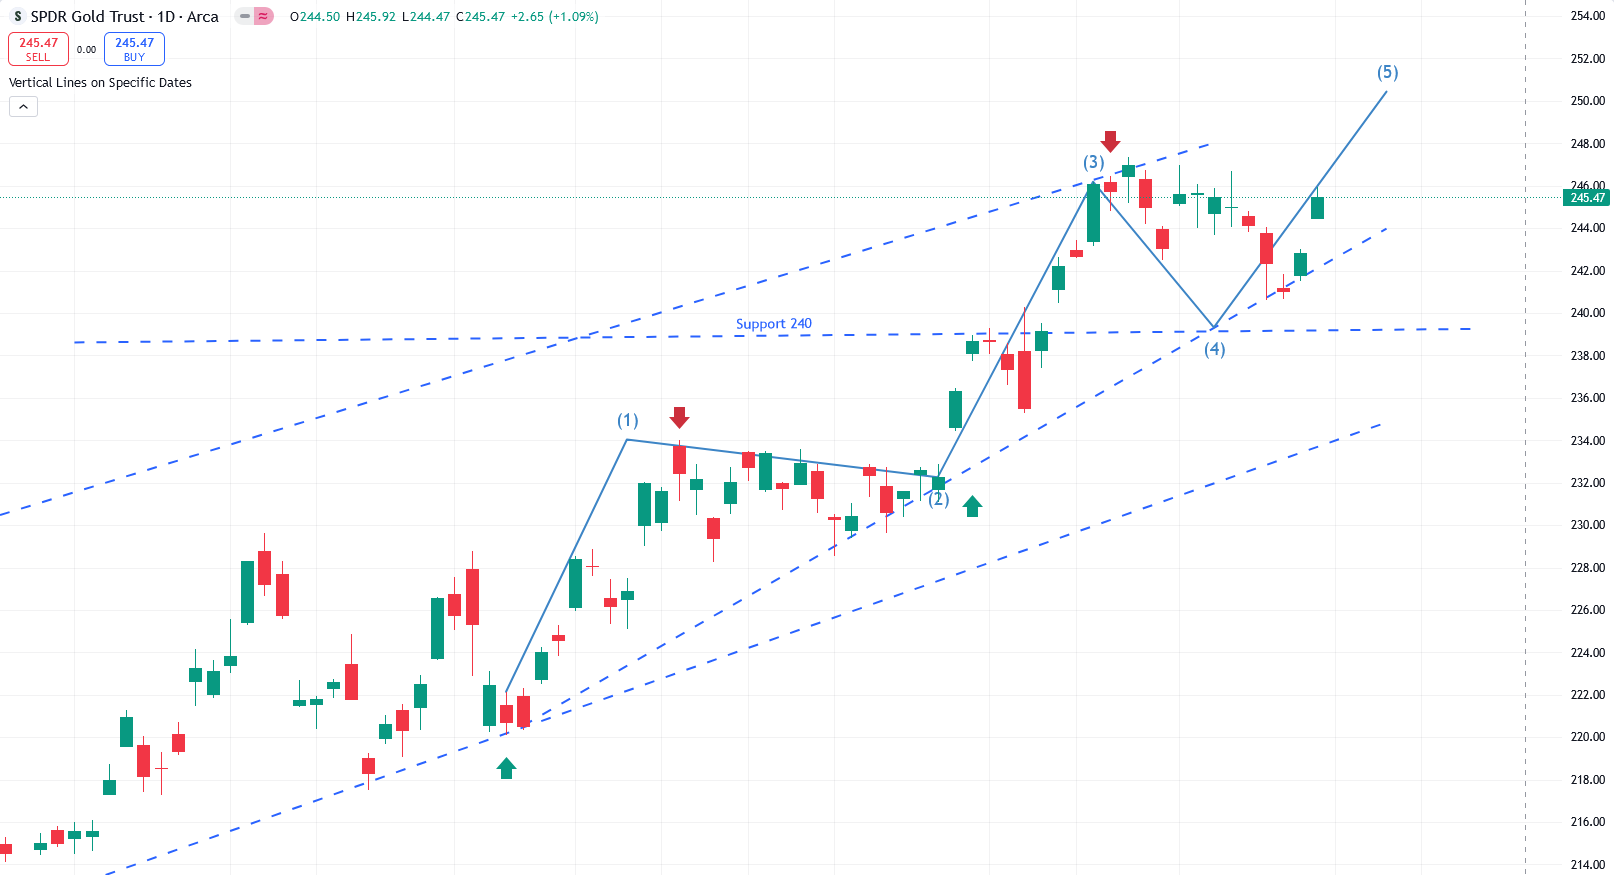
- GLD (Gold ETF):As mentioned in last week’s update, GLD dipped near the 240 level and has since resumed its uptrend. Technical indicators strongly suggest that gold is poised to continue higher over the next three months. It is approaching a potential resistance zone between 253 and 255, which may lead to some consolidation around the 250 mark before continuing its upward momentum.
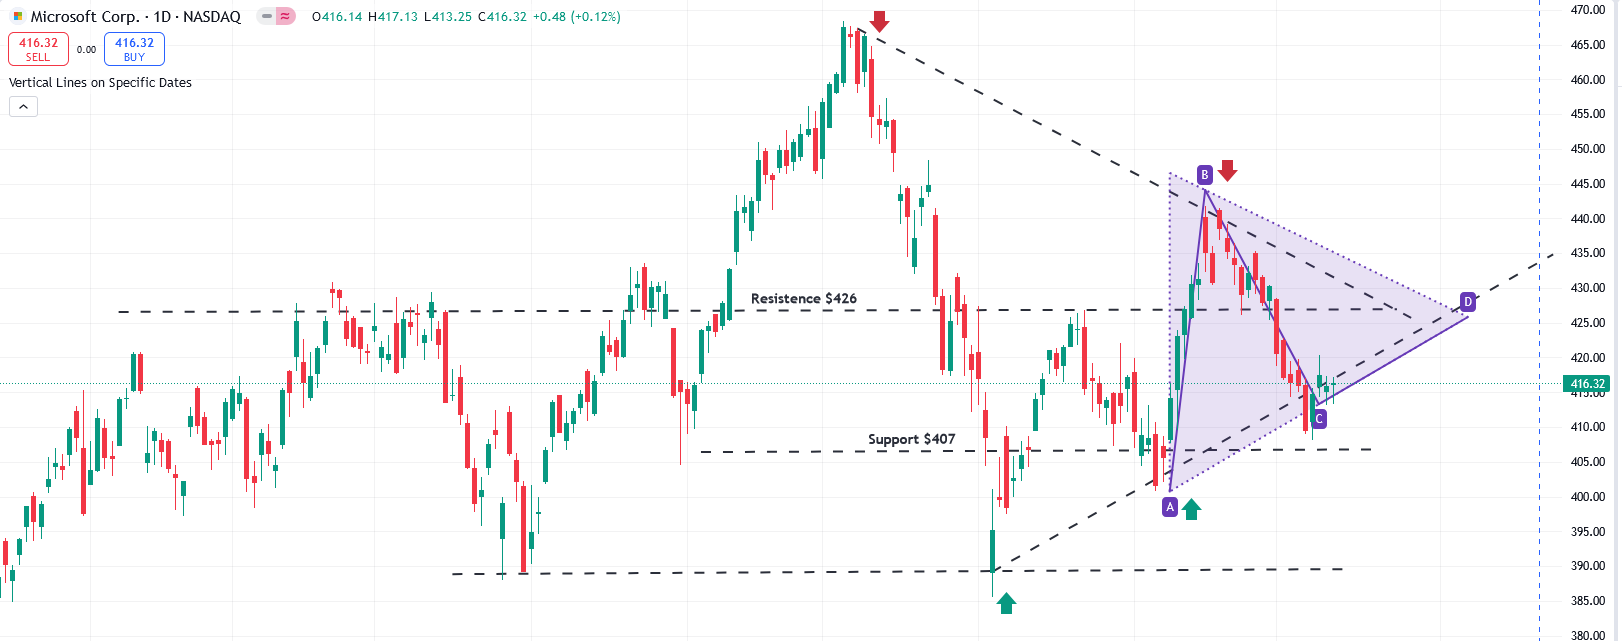
- Microsoft (MSFT): MSFT closed below its 200-day moving average, indicating strong resistance at this level. Both the Average Directional Index (ADX) and the Moving Average Convergence Divergence (MACD) are exhibiting bearish setups. Despite this bearish outlook, there is potential for the stock to decline to the 410 to 407 range before quickly resuming an uptrend towards 426. Historically, MSFT tends to correct ahead of its earnings reports, after which it often resumes its upward trajectory.
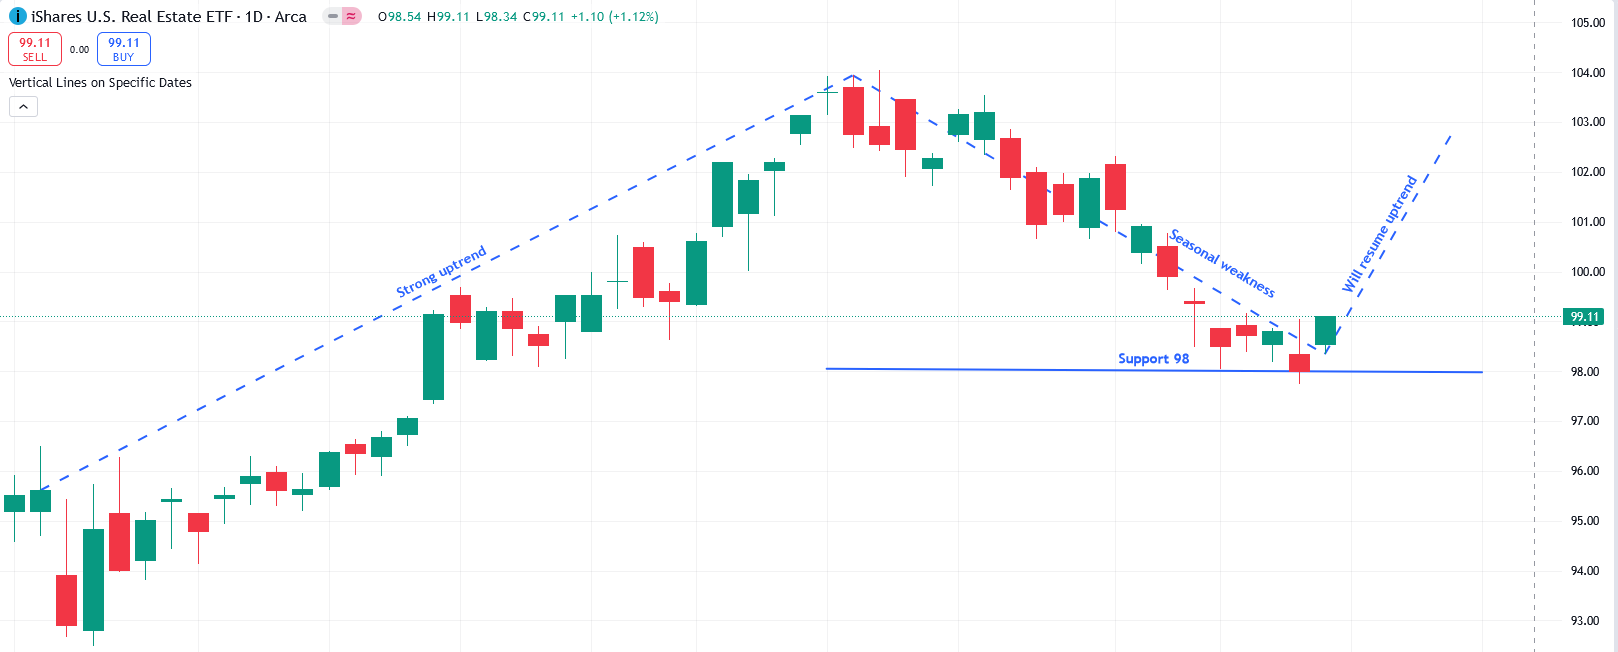
- Real Estate ETF (IYR): : Weakness in the real estate sector has persisted through the first half of October; however, there are signs of a potential uptrend resuming. Technical indicators for IYR show a strong upward trend over the past year, with the ETF currently resting on support near the 98 level. The recent rise in the 10-year yield and the increase in the 30-year fixed mortgage rates have dampened sentiment in the real estate market, presenting a buying opportunity. It is expected that IYR will resume its uptrend in the second half of October, targeting a move towards 103.
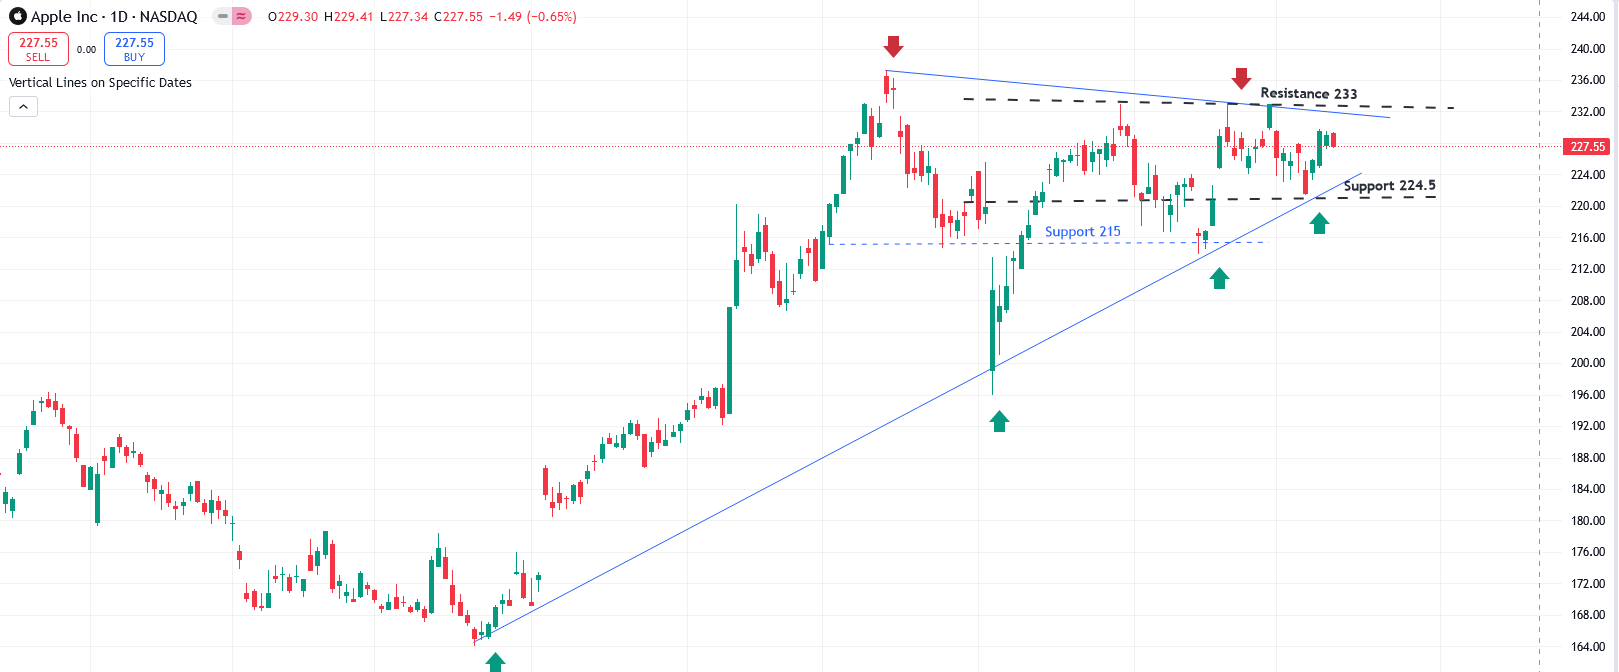
- Apple (AAPL): The technical indicators for AAPL remain bullish. However, the recent Chinese stimulus measures have led to some confusion regarding their impact on American companies operating in China. While these stimulus efforts are beneficial for China's economy, they could also have a positive effect on companies like Apple and Tesla, which derive substantial revenue from mainland China.
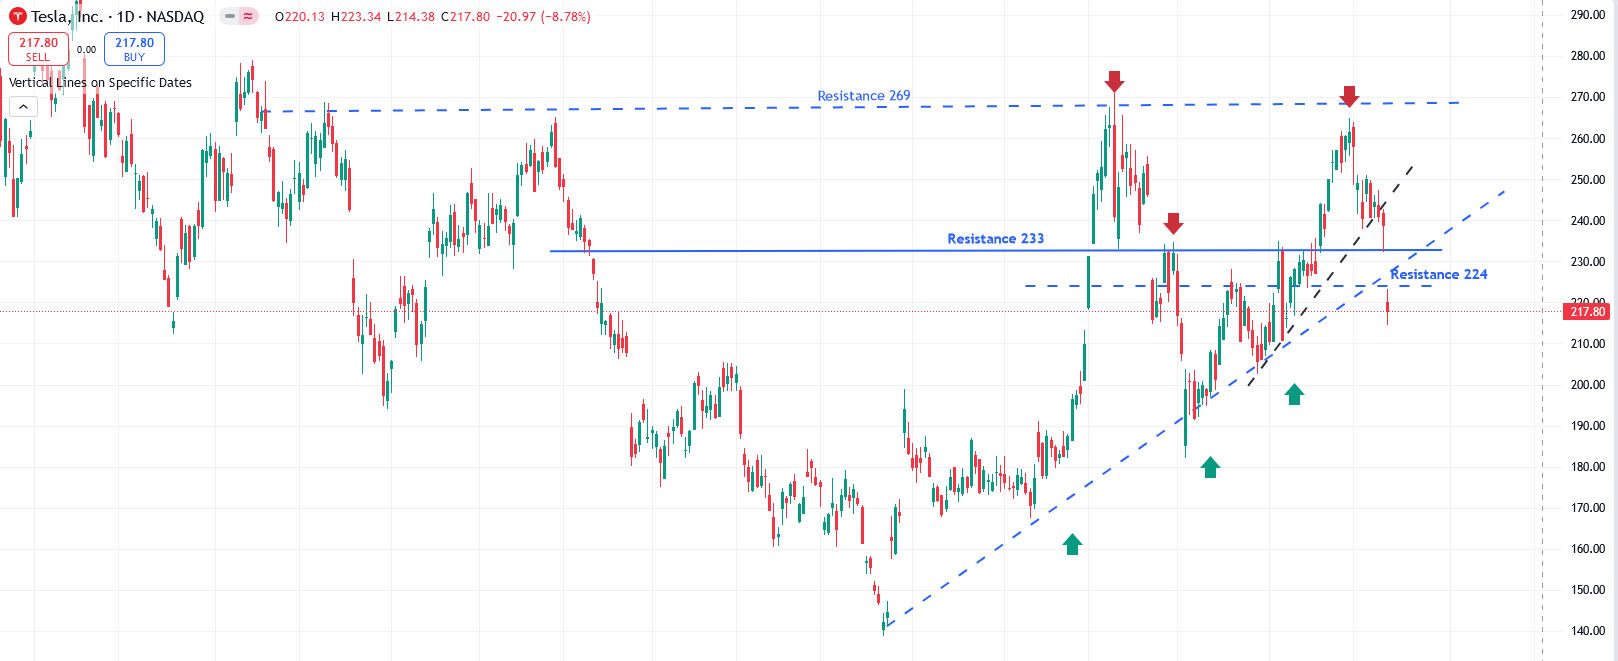
- Tesla (TSLA): While the robotaxi event on October 10th was perceived as innovative, the market is expressing skepticism regarding the timeline for transitioning from prototype to production. Current market speculation suggests that it may take approximately two years for the first robotaxi to reach retail availability. Investors typically dislike uncertainty, but history has shown that Elon Musk delivers on ambitious projects, whether it’s with SpaceX, Full Self-Driving (FSD) technology, or Tesla’s energy storage solutions. The recent correction presents a compelling opportunity to accumulate shares in anticipation of a post-election upswing, and we remain confident in TSLA's performance by year-end. We anticipate the stock will hover around $218 and may reach $224 by the end of the week. Historically, the next six weeks have been favorable for TSLA’s performance
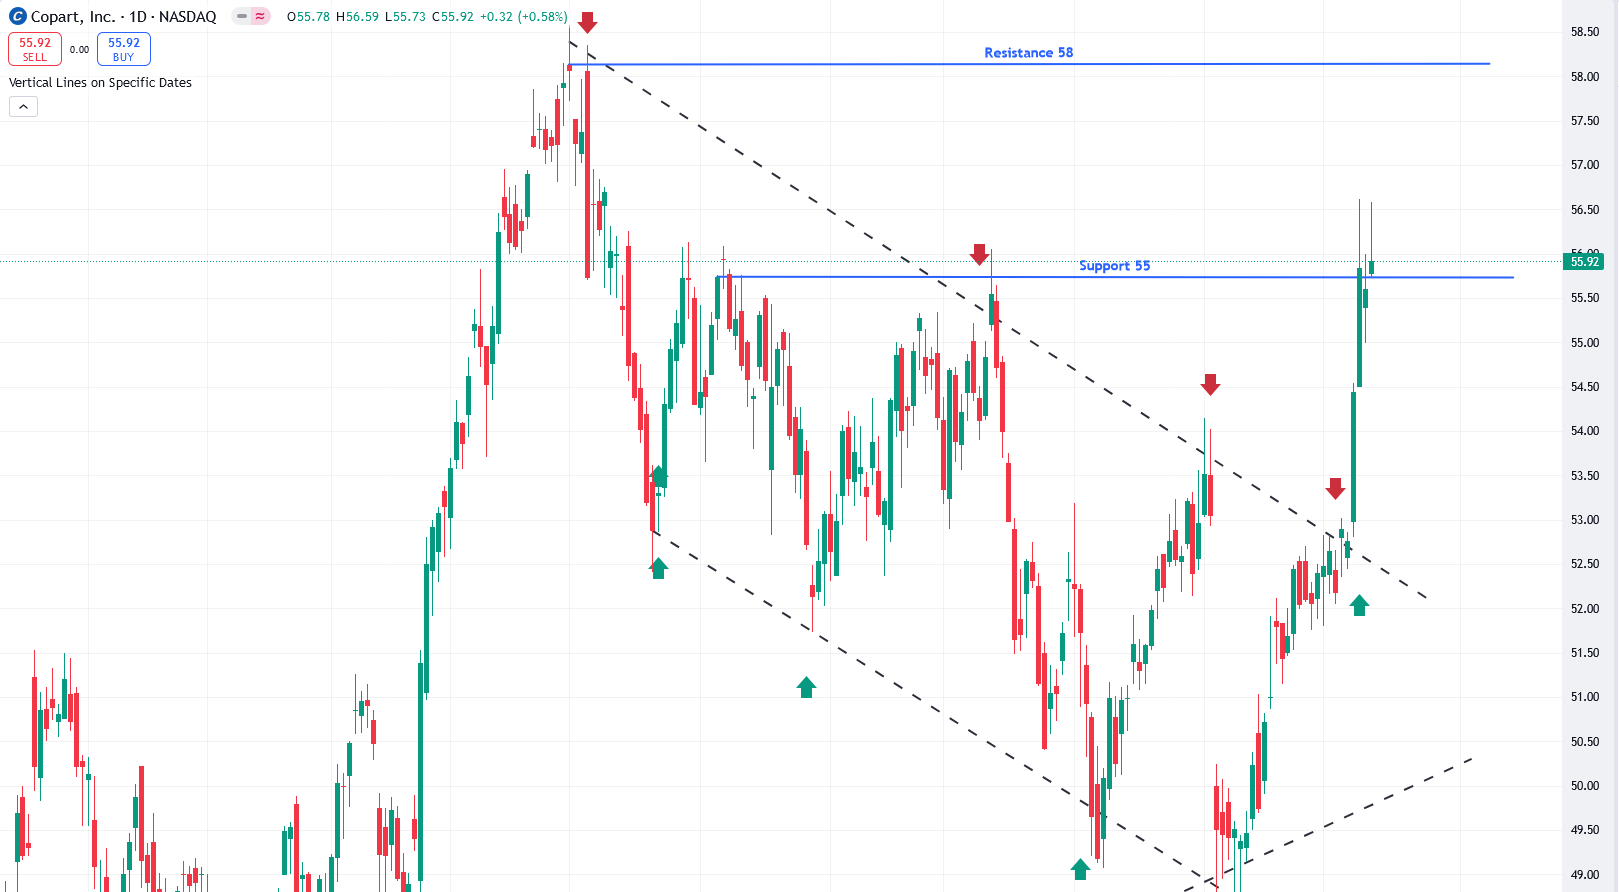
- Copart (CPRT)::CPRT is breaking out from a long-term trendline at 52.5 and is currently resting on support near 55. Technical indicators suggest that it is poised to move towards the upper resistance area around 58.
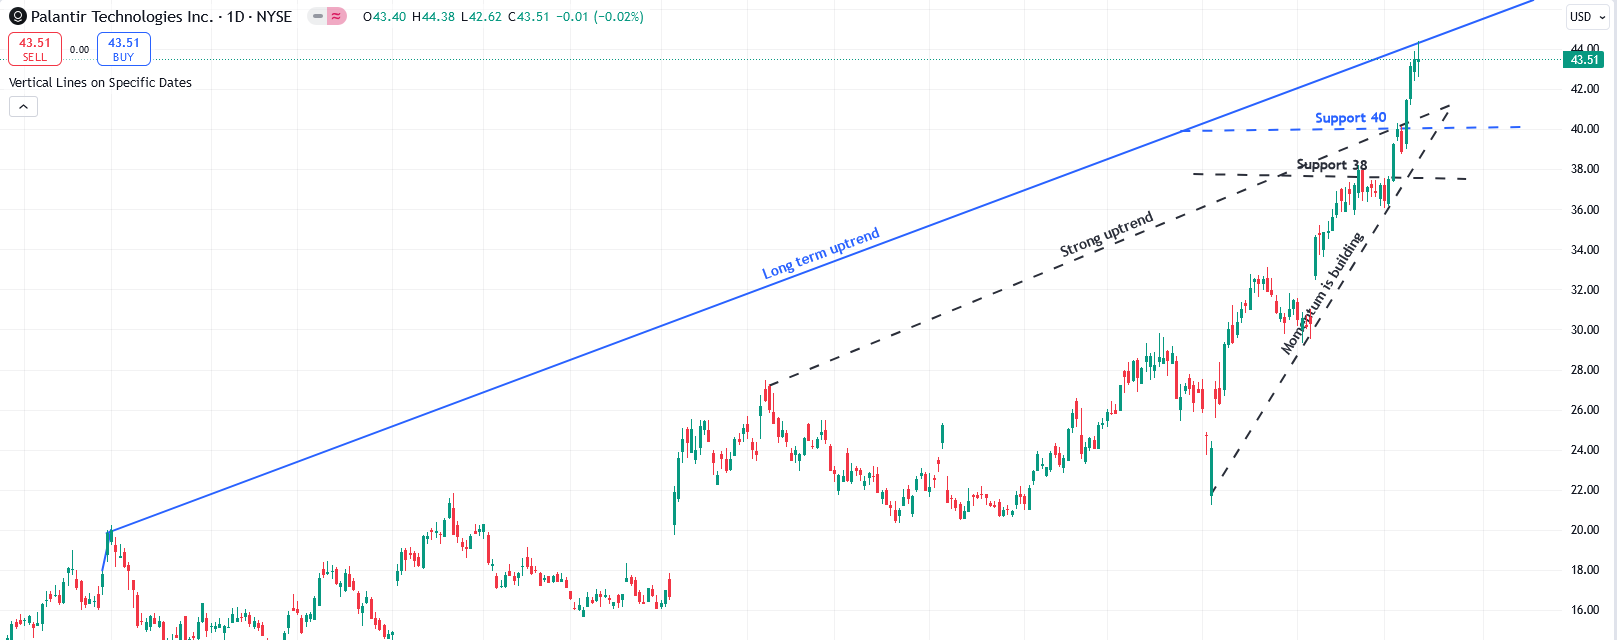
- Palantir Technologies (PLTR):: As noted last week, PLTR's uptrend remains intact, entering uncharted territory. It has established strong support at 38, suggesting significant potential for the stock to rise towards 50 by year-end.
🔥 Featured Trade Idea: DELL 🔥
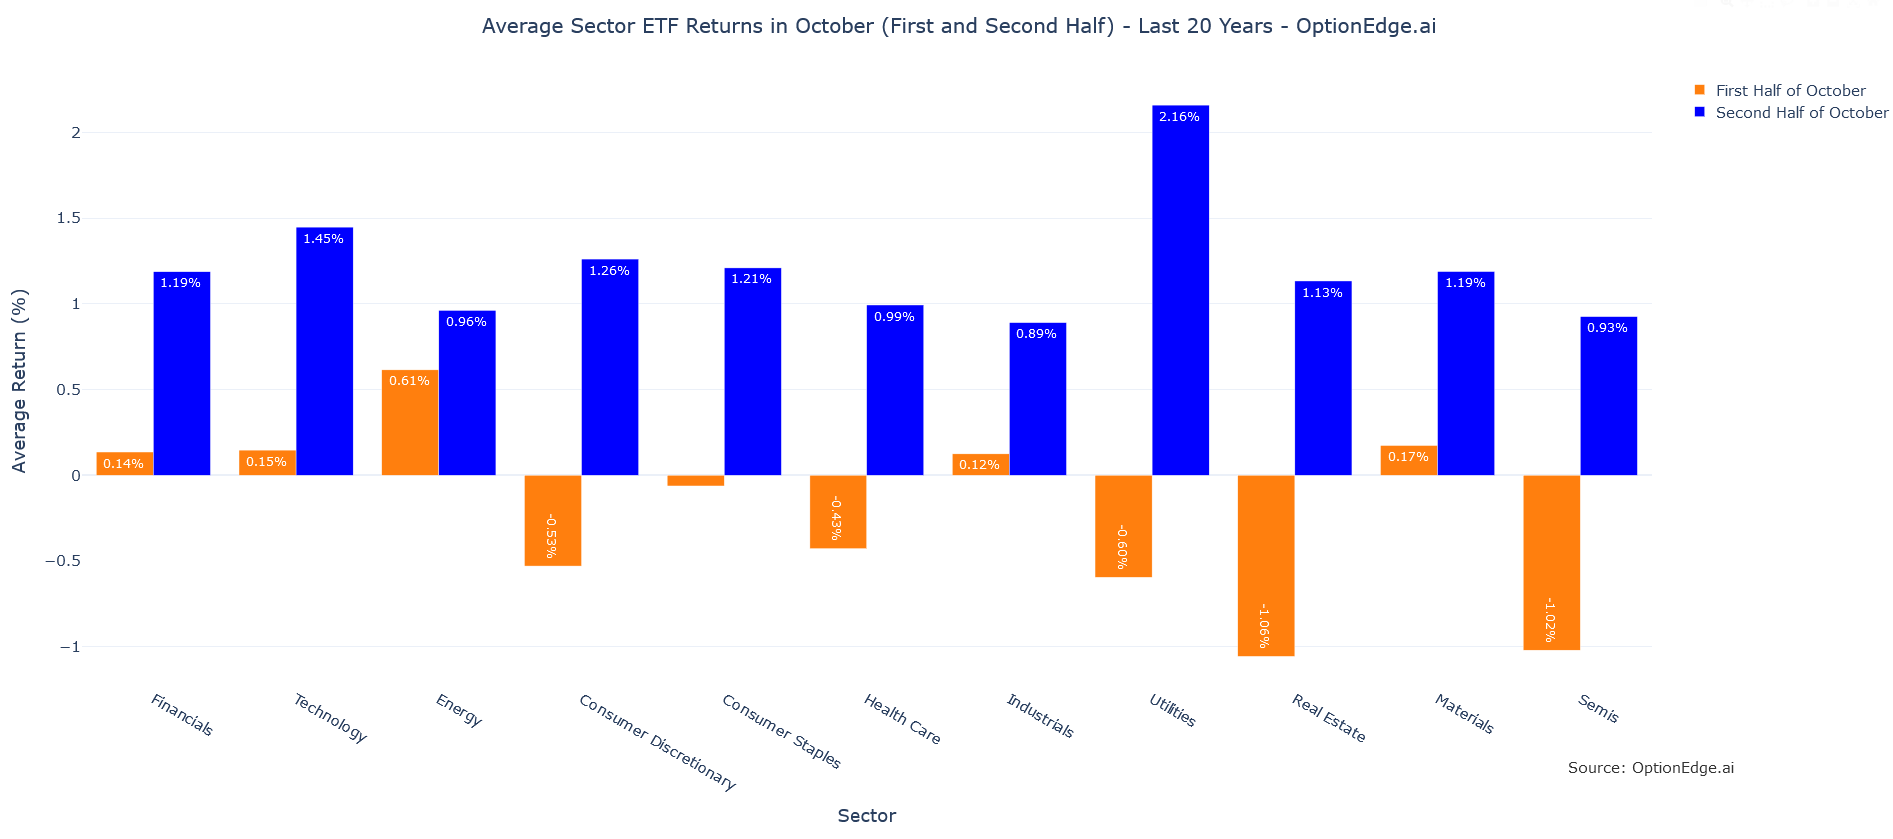
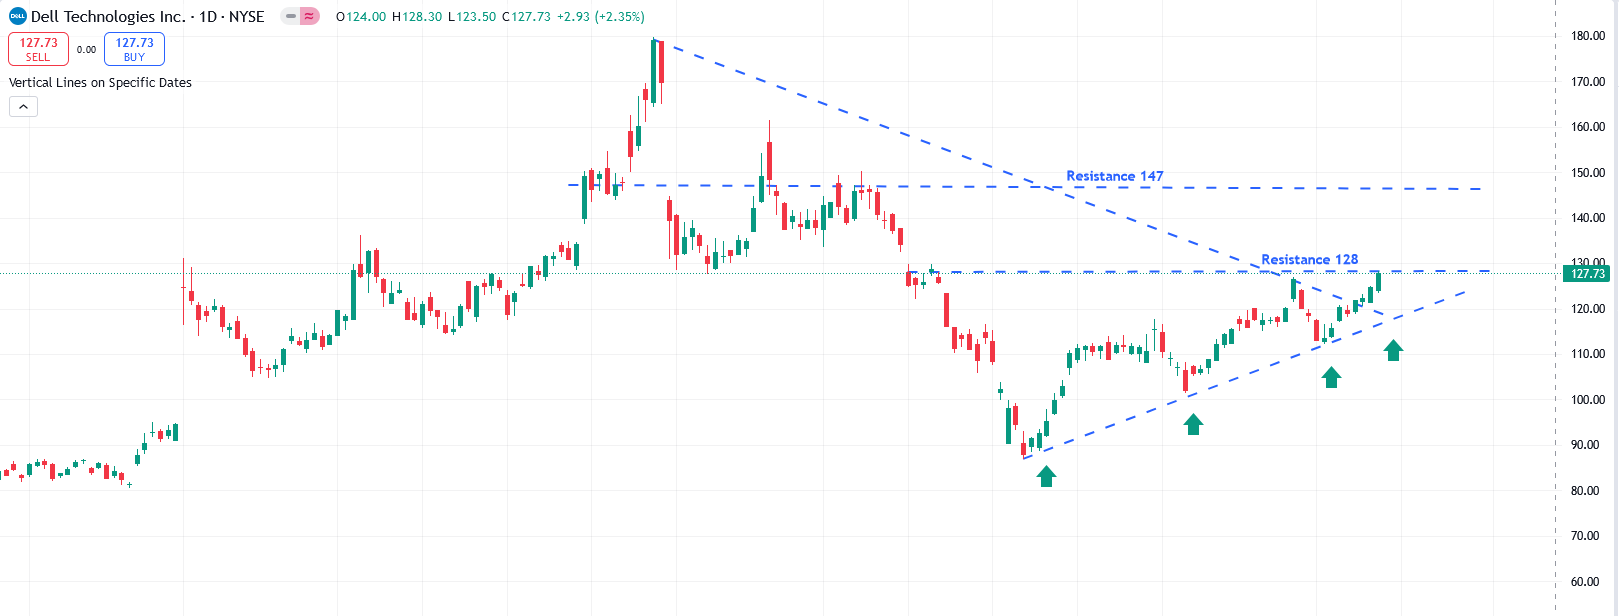
Rationale: Historically, the average return for the second half of October has been favorable across all sectors, but two sectors stand out: Utilities and Technology. However, for trading purposes, Utilities tend to be slower movers. Therefore, we have selected a company from the Technology sector. Dell is expected to deliver strong server demand over the next several quarters as AI adoption increases. Technically, Dell is currently facing resistance at $128. A breakout above this resistance could lead to a continuation of its upward momentum, potentially reaching $146. Additionally, as a recent addition to the S&P 500, Dell is poised for significant gains.
💡 Trading Tip of the Week: Maximizing Returns with a "Covered Call" and "Cash-Secured Put" Strategy 💡
Leverage the "Covered Call" strategy to generate additional income from your existing stock holdings. By selling call options on stocks you already own, you can collect premium income. If the stock price remains below the strike price, you retain both the premium and your shares. If the stock price exceeds the strike price, while your shares may be called away, you still profit from the premium and any capital appreciation up to that strike price.
To enhance your income strategy, consider adding a "Cash-Secured Put" approach. This involves selling put options on stocks you are willing to buy at a lower price. By doing this, you can earn premium income upfront while also setting up a potential entry point for purchasing the stock at a discounted price. If the stock price remains above the strike price, you keep the premium; if it falls below, you acquire the stock at an attractive valuation, effectively lowering your cost basis.
Combining these two strategies can provide a balanced approach to income generation and risk management. This way, you can capitalize on market movements while maintaining flexibility in your investment strategy.
This research is intended for OptionEdge AI clients only.
OptionEdge AI subscriptions are limited to a single user, and this research must not be shared, redistributed, or disclosed to others. For more information, please contact support@optionedgeai.com.
Conflicts of Interest
This research reflects the views, opinions, and recommendations of OptionEdge AI. At the time of publication, OptionEdge AI has no knowledge of any material conflicts of interest related to this content.
General Disclosures
OptionEdge AI is an independent research firm and is not registered as an investment advisor or broker-dealer under any federal or state securities laws.
This communication is issued by OptionEdge AI for informational and educational purposes only. It is not a personal recommendation, offer, or solicitation to buy or sell any securities, financial products, or services. This material should not be considered legal, tax, accounting, or investment advice. It is not prepared in compliance with legal requirements to promote the independence of investment research and is not subject to any prohibition on dealing ahead of its dissemination.
This document is intended solely for the recipient and may not be distributed without the prior consent of OptionEdge AI.
Copyright © 2024 OptionEdge AI. All rights reserved. No part of this material may be reprinted, sold or redistributed without the prior written consent of OptionEdge AI