Hello! We’re excited to bring you this week’s top trade ideas and market insights. Stay ahead with OptionEdge.ai! 🚀
Welcome to Your Weekly Edge 🎯
Weekend Update on Trading Insights and Opportunities
By OptionEdge.ai
Exclusive Premium Content
This is content that only premium members can access.
Market Recap
For the week ending October 4, 2024, the markets appeared ready to move forward, giving the impression of calm. However, beneath the surface, we see significant imbalances. Let's dissect these developments in detail.
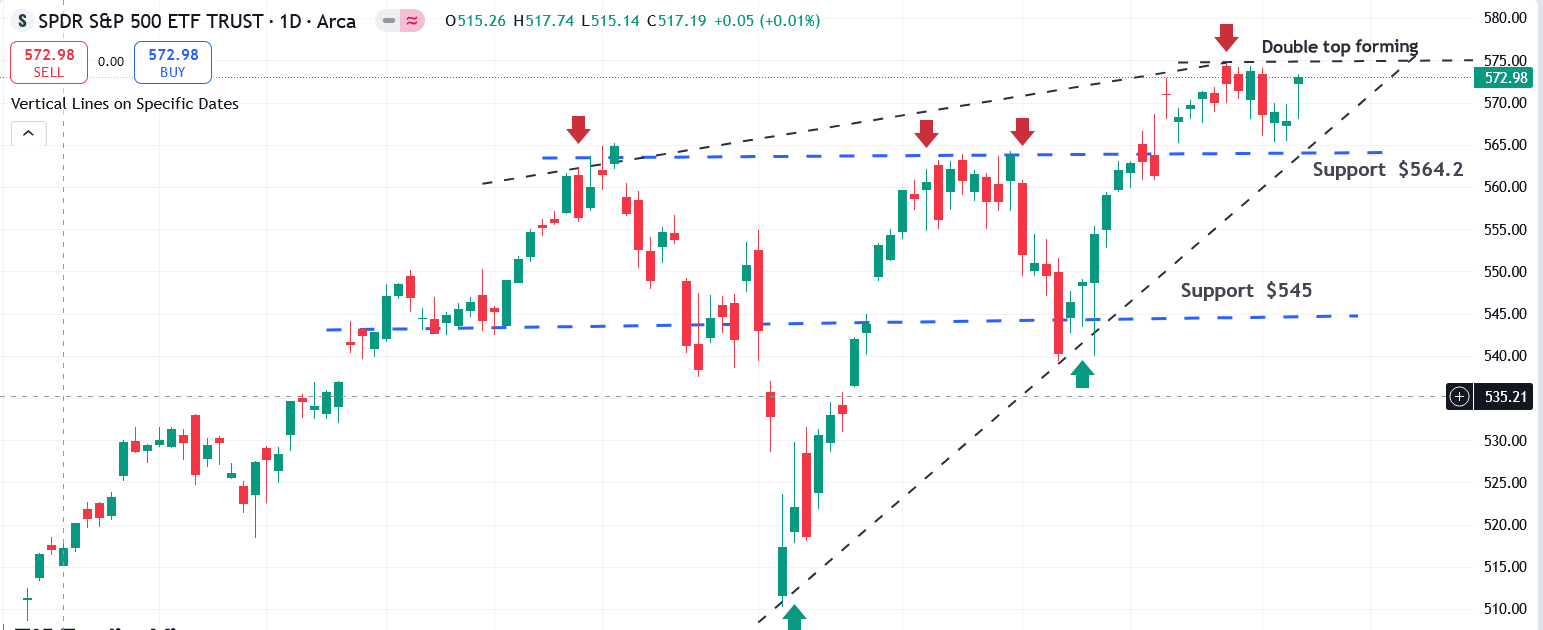
- SPY (S&P 500 ETF): The SPY experienced volatility at the beginning of the week but closed slightly positive by Friday, buoyed by strong job numbers. The market’s initial reaction to such economic data can often be misleading, with the real movement emerging in the following days. We expect volatility to increase due to rising yields and geopolitical tensions. While we remain bullish on the long-term market outlook, we are tactically cautious. Our expectation is for the VIX to spike, leading SPY to drop by 3% to 4%, targeting the 546 to 550 range in the next two weeks. This bold call is supported by our Quant model, which also indicates that institutions are rapidly increasing their cash reserves ahead of the elections. Next week’s focus will be on the FOMC minutes and CPI data for further clarity.
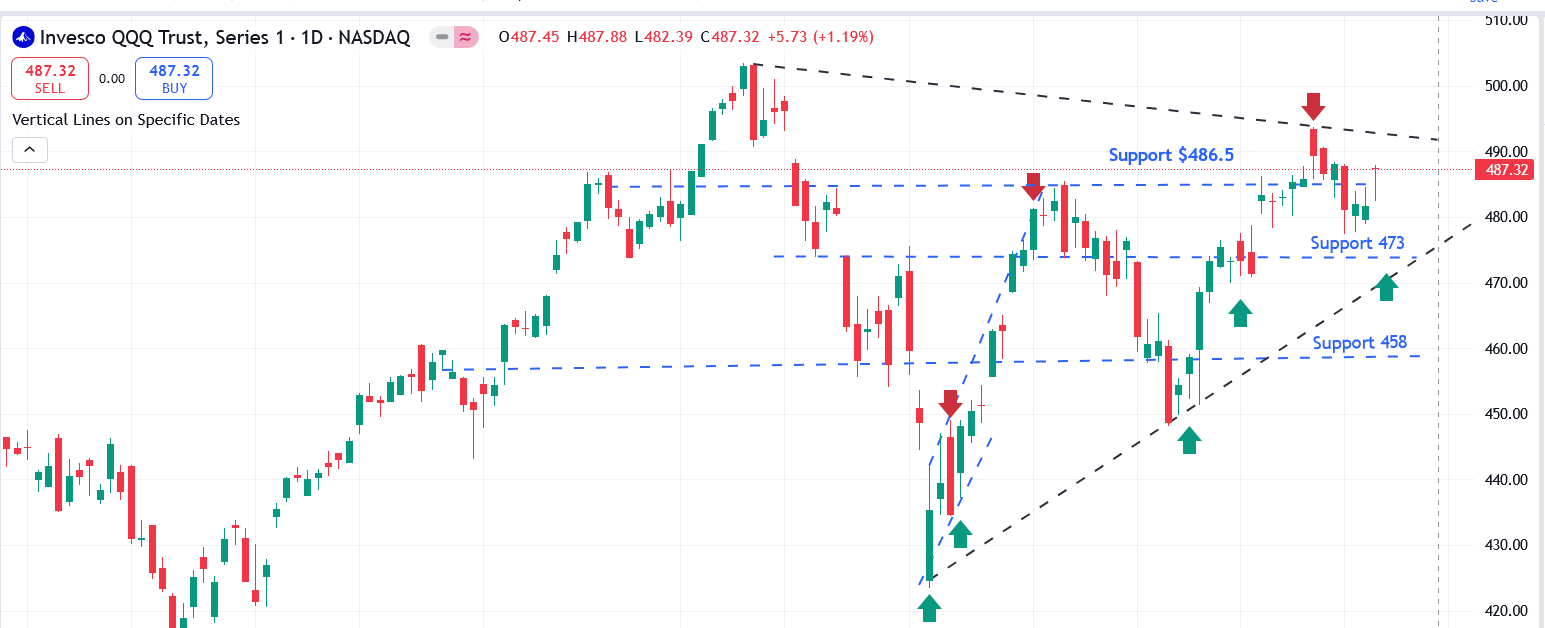
- QQQ (Nasdaq 100 ETF): Like SPY, QQQ started the week on a downtrend but managed to close positive, thanks to key constituents like Meta and Google, which helped lift the index into the green.
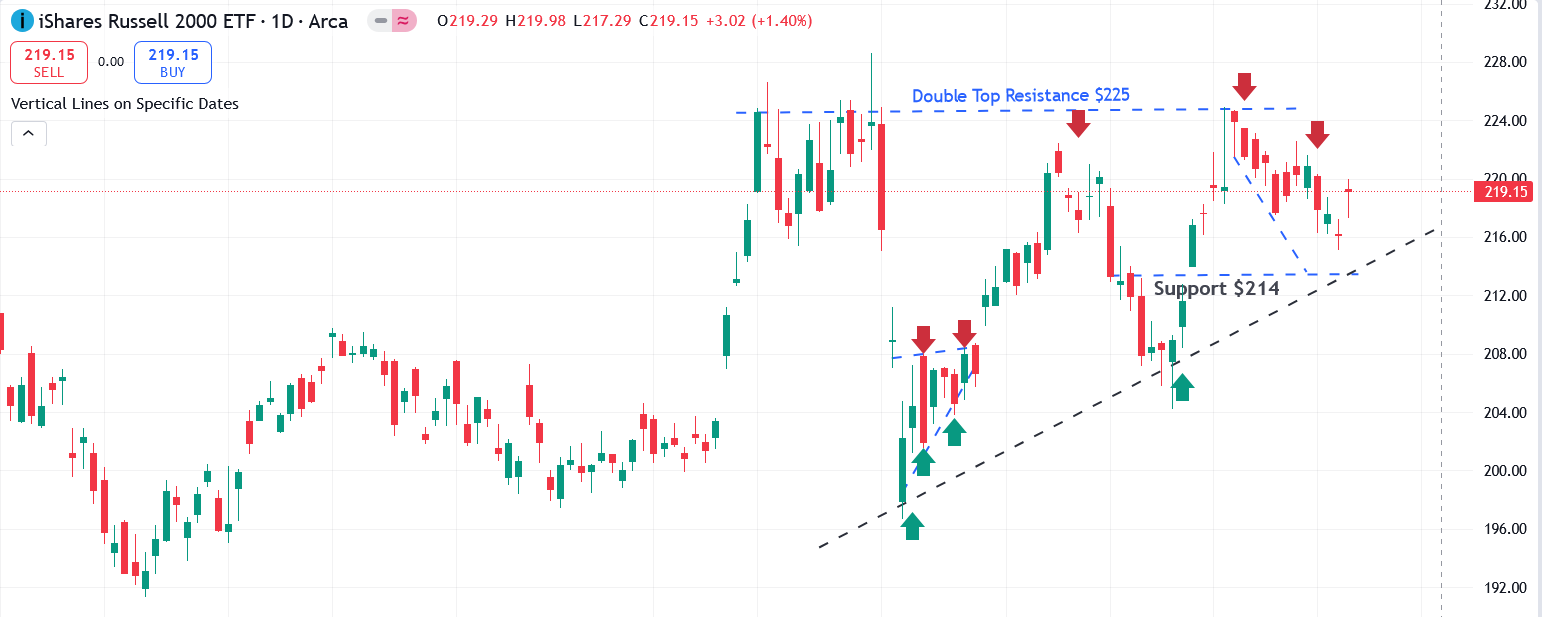
- IWM (Russell 2000 ETF): IWM had a weaker performance, ending the week lower. The strong job numbers have resurfaced concerns about how higher interest rates will affect smaller companies, and historically, the next two weeks are particularly challenging for small caps during election years.
In summary, while SPY showed resilience, QQQ faced challenges due to its tech-heavy composition, and IWM lagged under economic pressures. As mentioned in our mid-week insight on October 2nd, Meta and IYR performed excellently. However, our bearish outlook on AMD and SPY didn't play out as expected. We're currently reinforcing our Quant model with actual results to improve its accuracy moving forward.
Next Week's Action Plan
Looking ahead, the focus for next week will be on key economic data, including FOMC minutes on Wednesday, CPI on Thursday, and PPI on Friday. Volatility is likely to remain high as investors react to signals about the Federal Reserve's future policy decisions. Following the strong jobs report last Friday, the 30-year mortgage rate jumped 0.27% to 6.53%, and the 10-year Treasury yield spiked to 3.97%. Rising yields could dampen market performance. If inflation data continues to soften, combined with strong job growth, it could signal a "Goldilocks" scenario, where the economy is in balance. However, if inflation ticks up, it will likely be seen as a Fed policy mistake in cutting rates by 50bps in September and perceived as a headwind to corporate earnings. Also Market will react to it, if Fed easing cycle off the table due to strong econmic data and hot inflation.
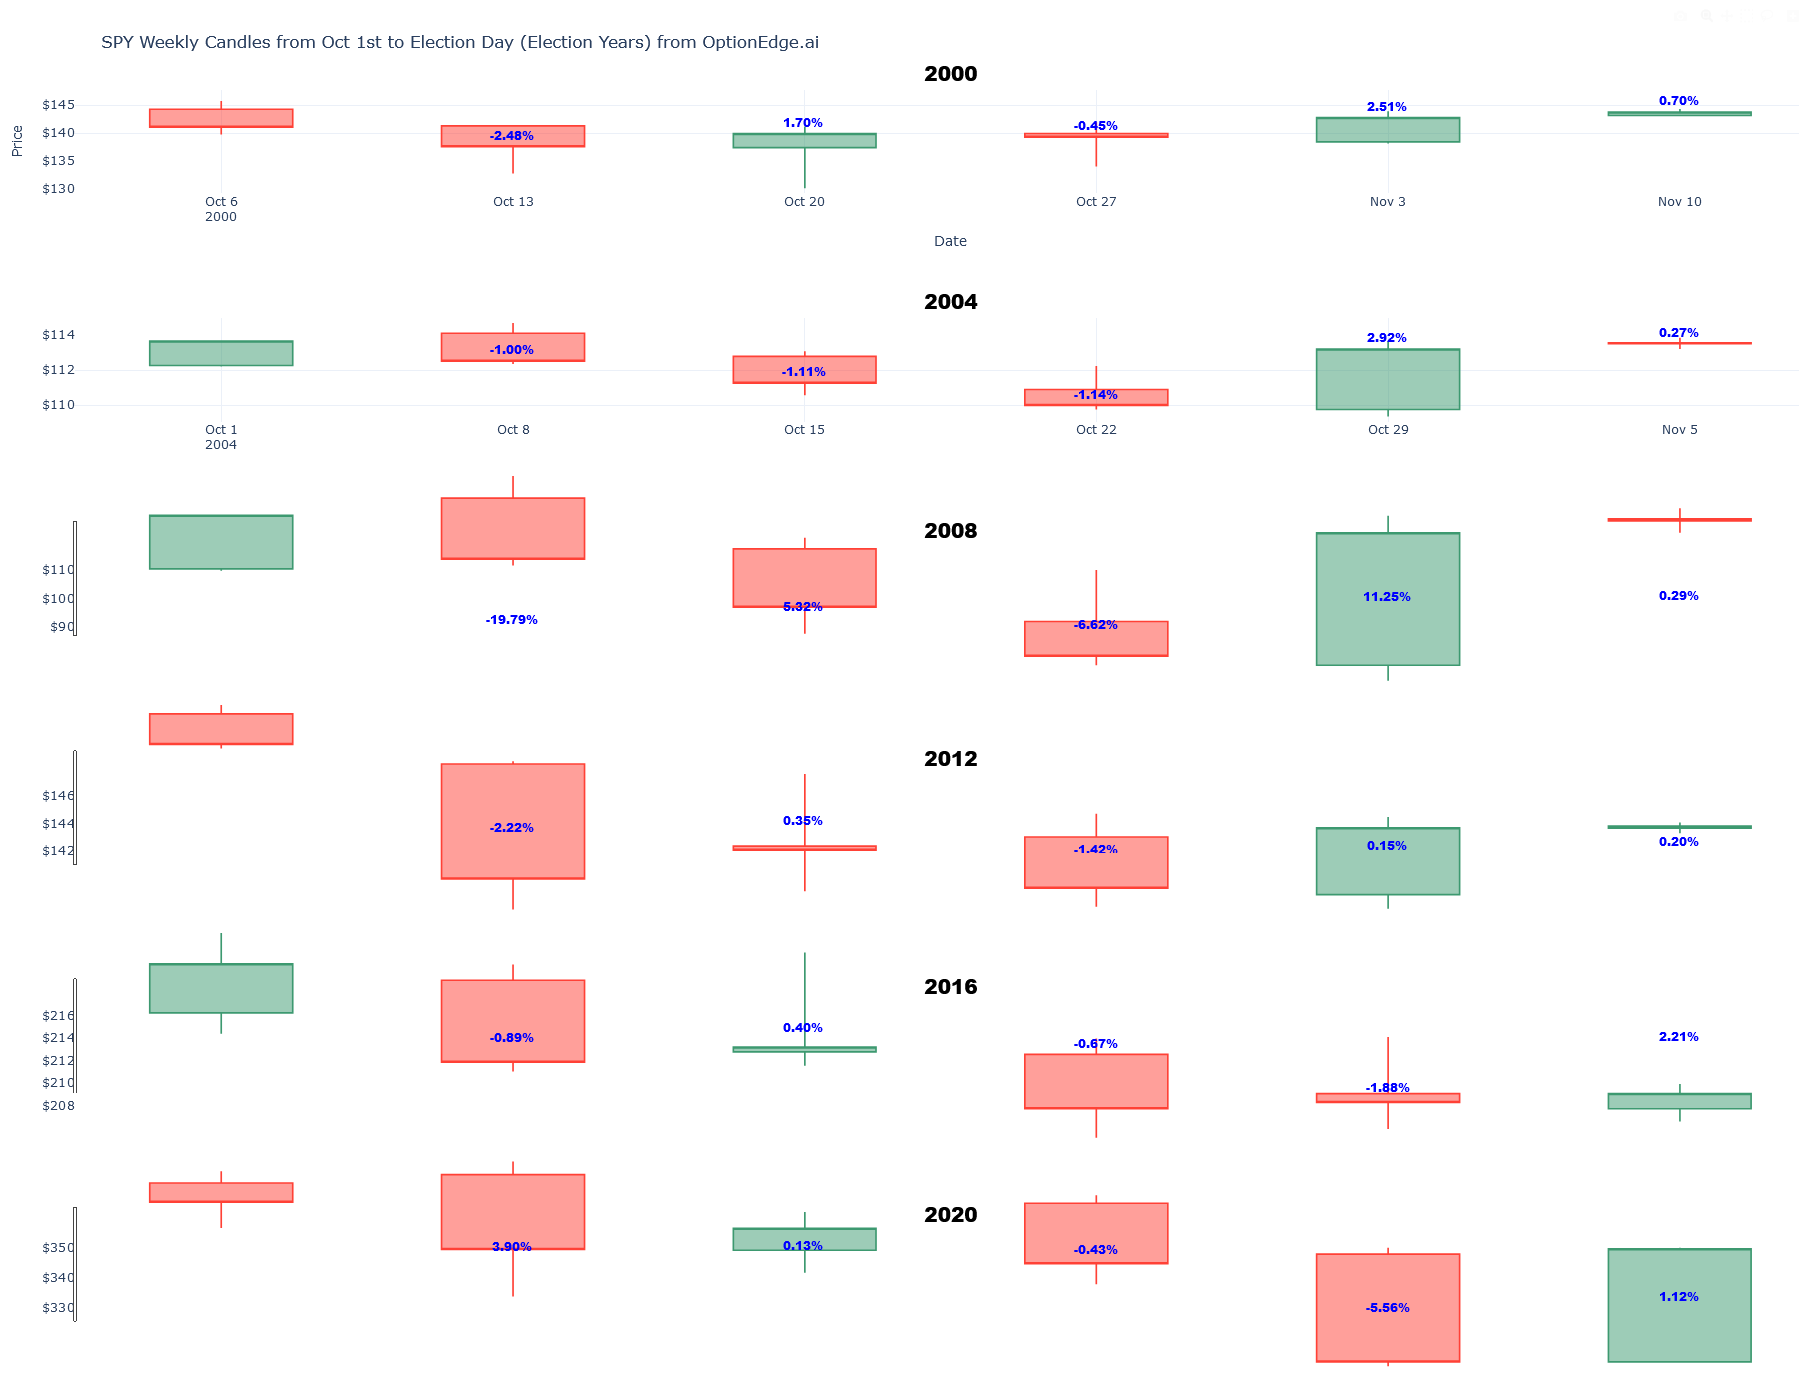
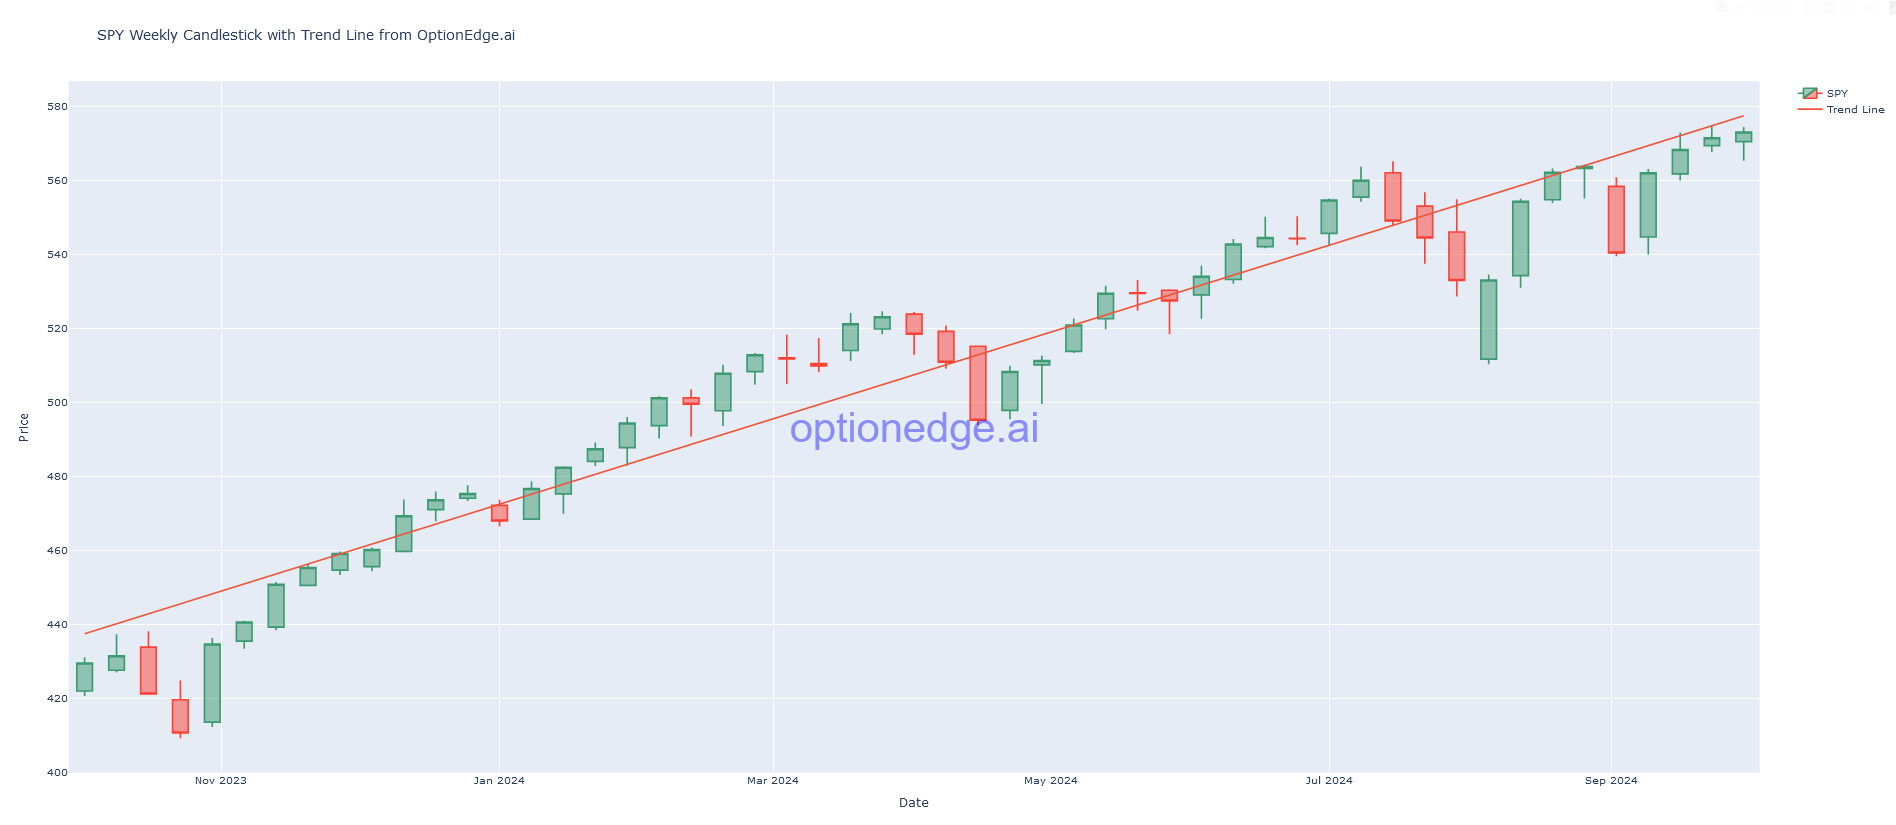
- SPY: SPY continues to exhibit a bearish setup. The "Hanging Man" pattern at Friday's close indicates that buyers are exhausted. Historically, the second week of October during election years has been bearish as seen in above chart, and it wouldn’t be surprising to see SPY drop by 20 points to close around 550 by the end of the week. Over the last 25 years, the second week of October has never closed with a green candle during election years. However, this is a tactical outlook, and we expect SPY to resume its upward trend after the elections and finish the year stronger.
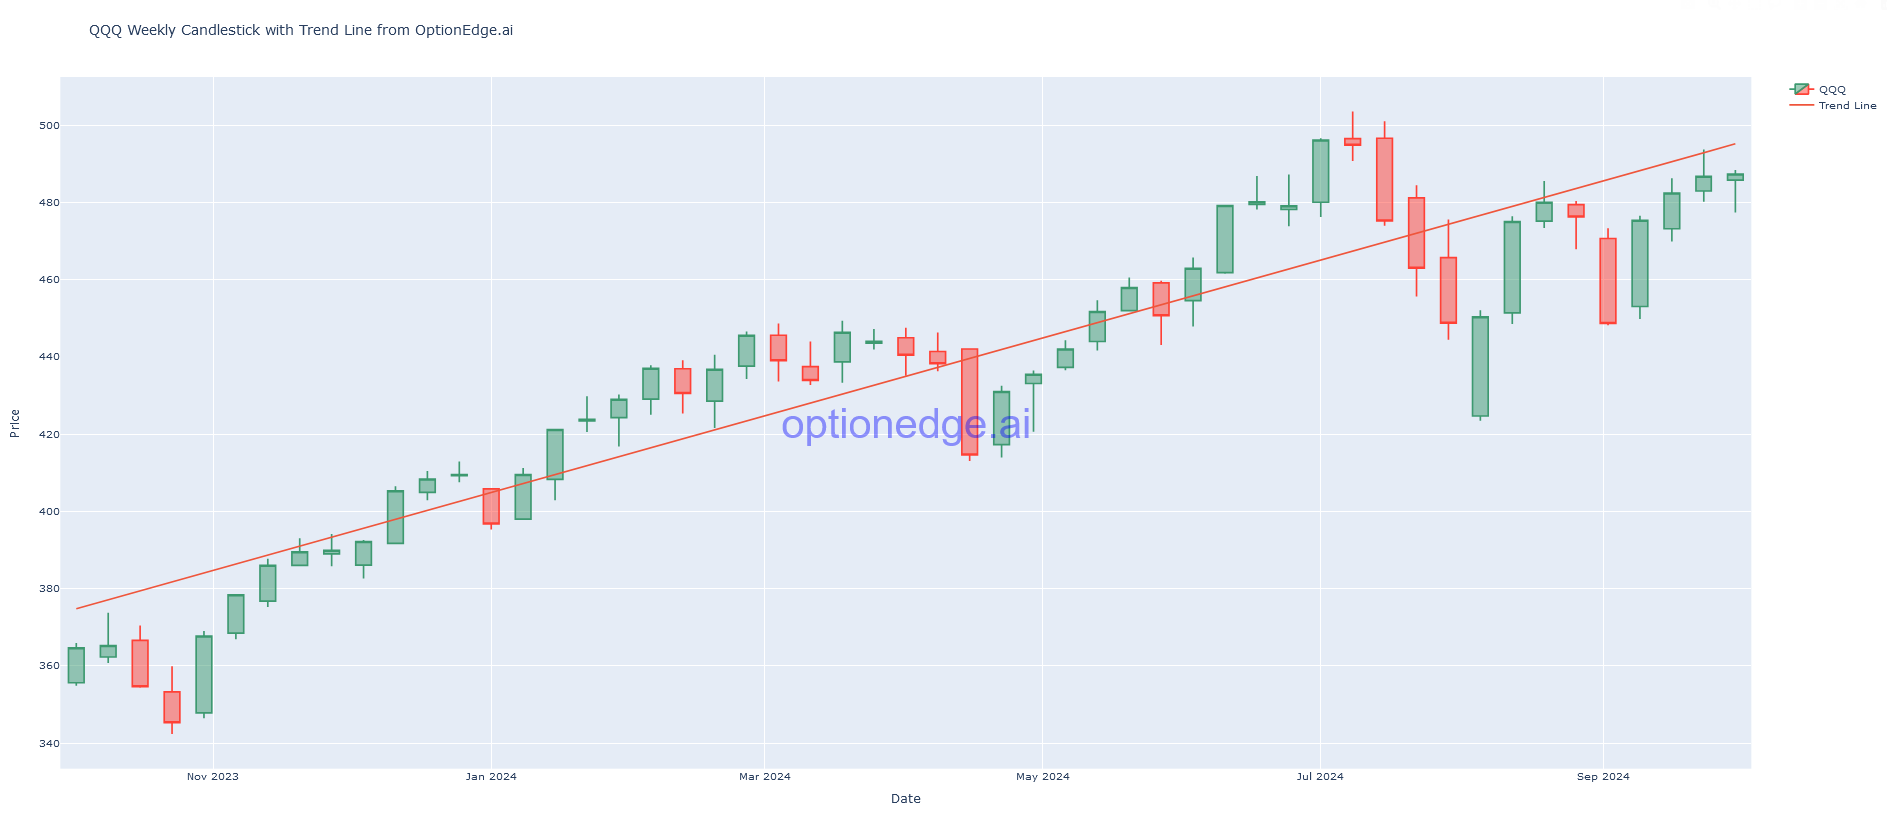
- QQQ: The weekly trendline, as generated by our Quant model, shows QQQ hovering just below the trendline. The longer it remains near the line, the greater the risk of further downside.
- IWM: IWM closed below its trendline on the weekly chart. Small-caps are particularly vulnerable to any missteps in Fed policy, and we expect consolidation around current levels. Traders should proceed cautiously in this volatile environment.
Featured Trade Ideas
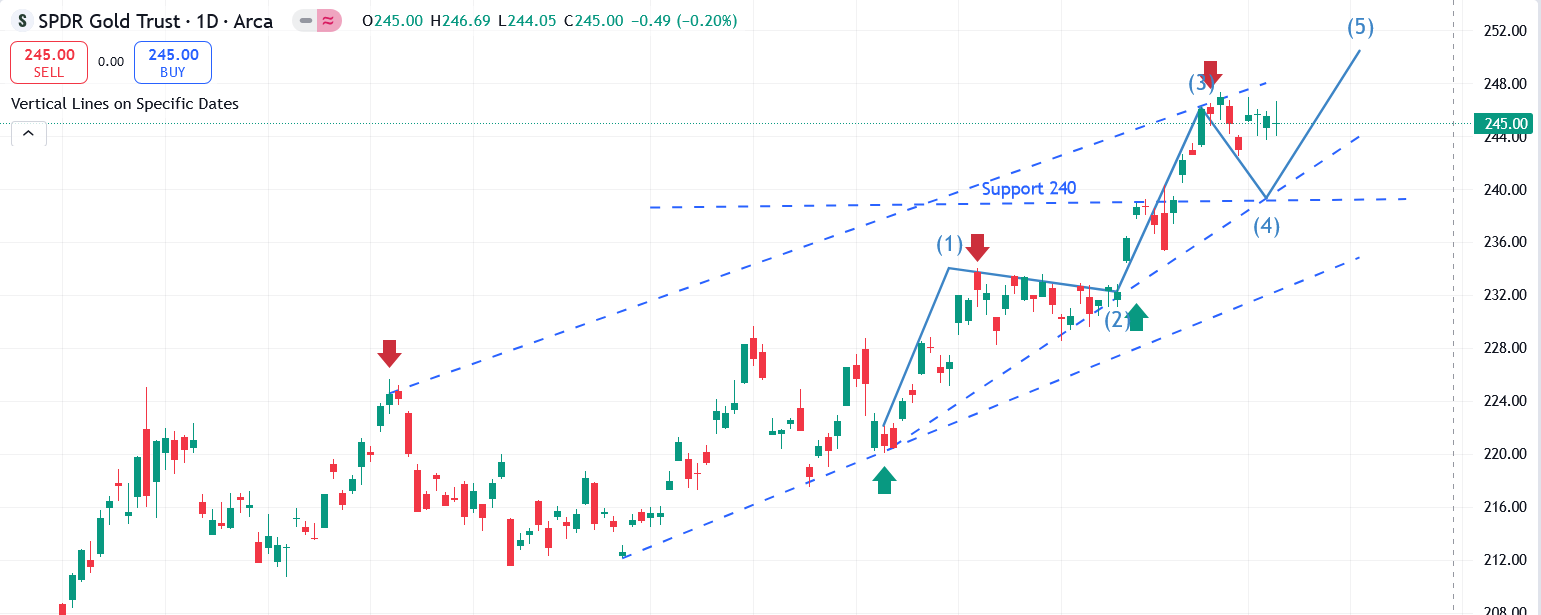
- GLD: Struggling to maintain momentum, GLD lost steam following the strong jobs report. However, we expect it to resume its upward trend in the coming weeks as it forms a Wave 4 pattern, signaling a potential continuation of the previous uptrend. If inflation data on Thursday surprises to the upside, GLD could retrace to 240 in the short term. On the other hand, if inflation cools, we anticipate GLD will resume its upward trajectory, aiming towards $250.
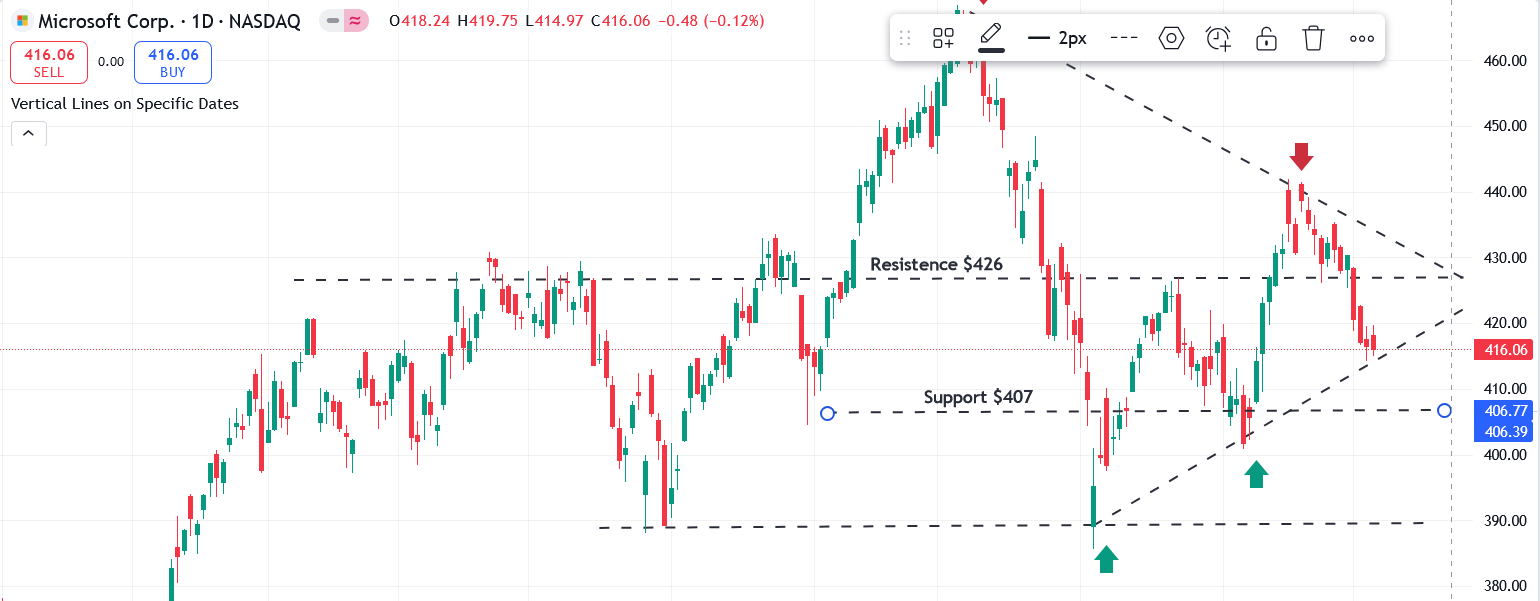
- Microsoft (MSFT): MSFT closed just below its 200-day moving average and is resting on a trendline. However it is bearish setup. If it breaks below the trendline at 415, we expect support around 407.
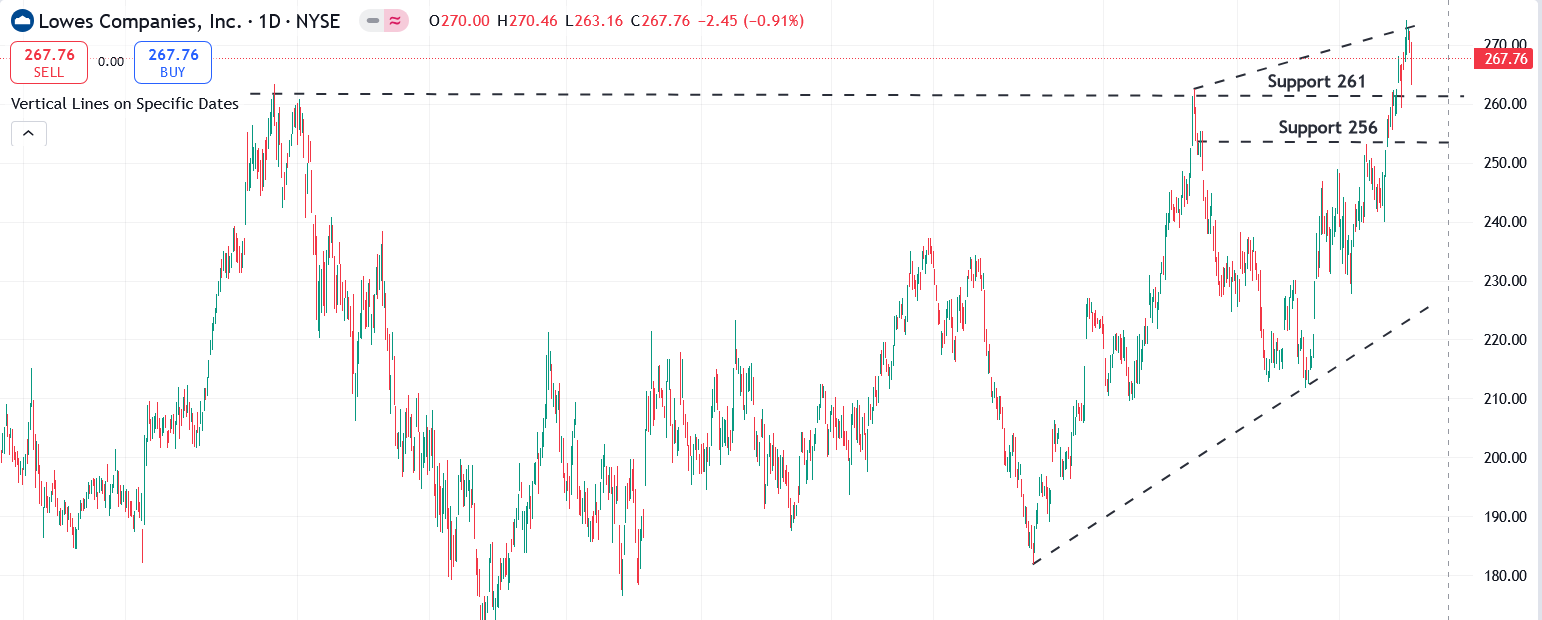
- Lowes (LOW): LOW shows signs of exhaustion at its all-time high (ATH). The mortgage rate increase on Friday is likely to impact LOW, with immediate support at 261. It likely retrace to immediate support.
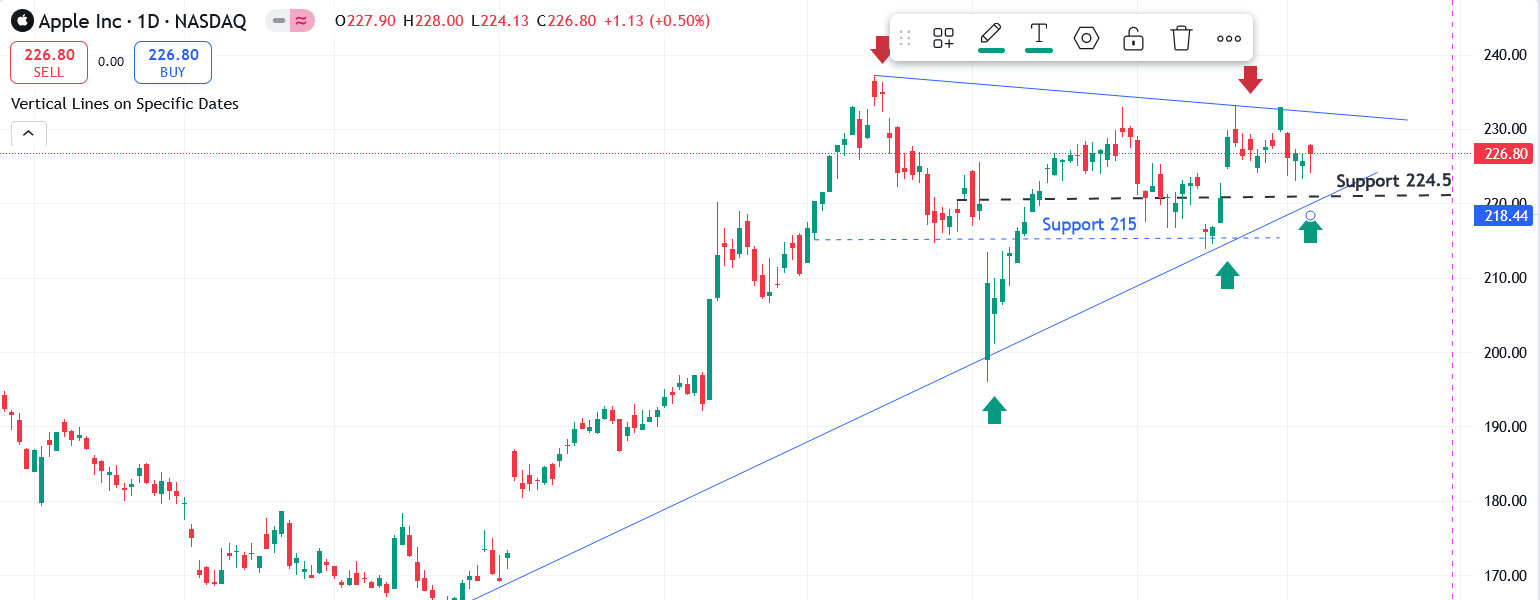
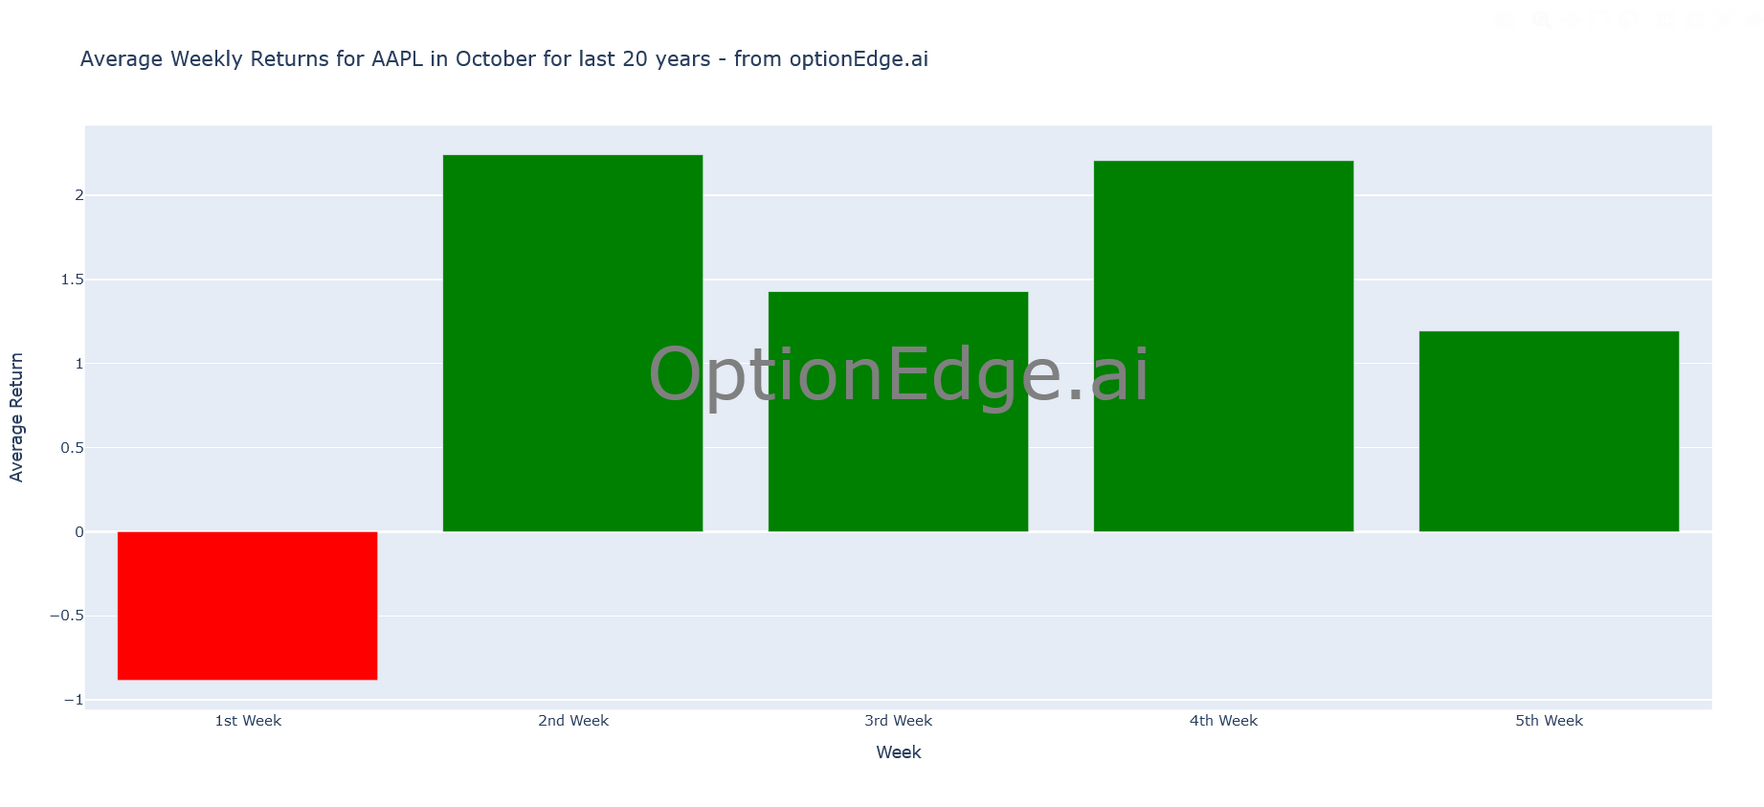
- Apple (AAPL): The technicals remain supportive. As previously noted, AAPL often shows weakness during the first week of October but tends to perform well in the following weeks. On September 30th, when AAPL gapped up by 6 points, we advised through our Quant Chart section to exit and re-enter on Monday, October 7th. Consider buying AAPL next Monday and holding it through the election period for potentially better returns.
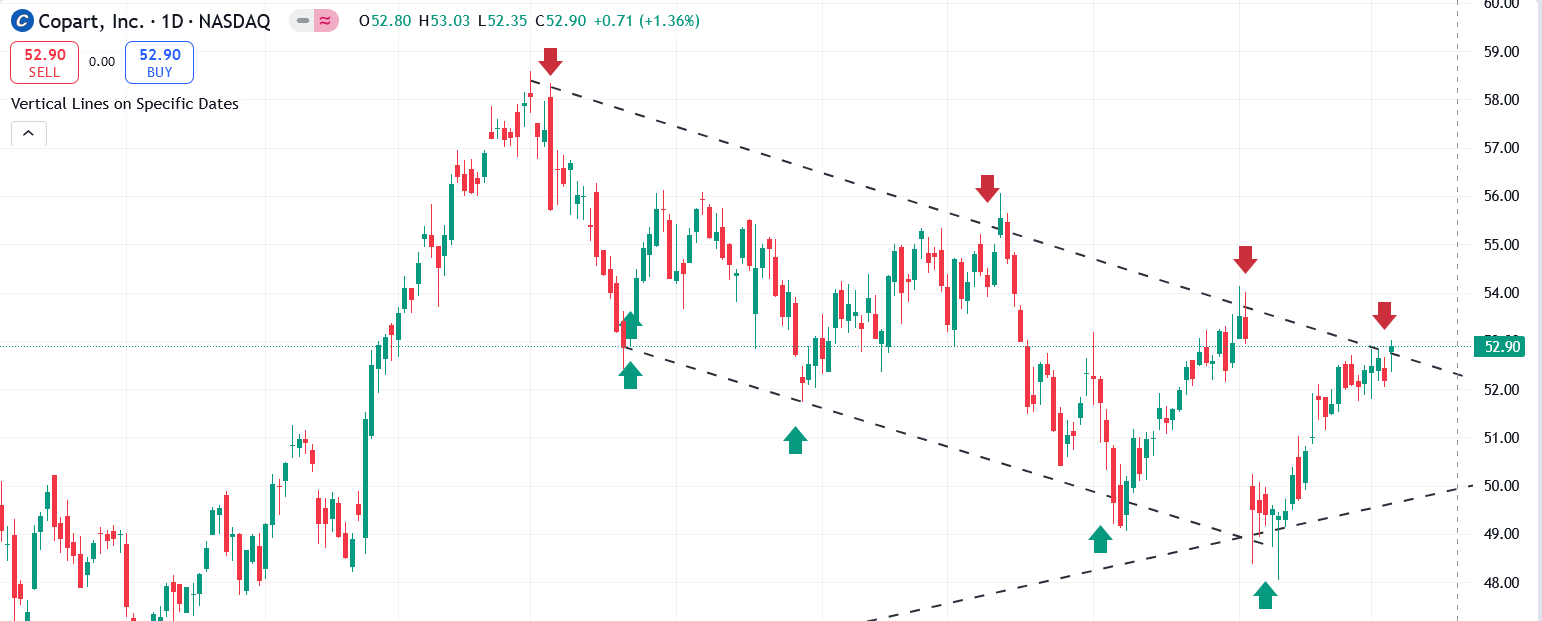
- Copart (CPRT): CPRT is once again hitting its upper trendline. Historically, every time it touches the upper trendline, it finds support at the bottom of the channel. We’ll see if this time is any different.
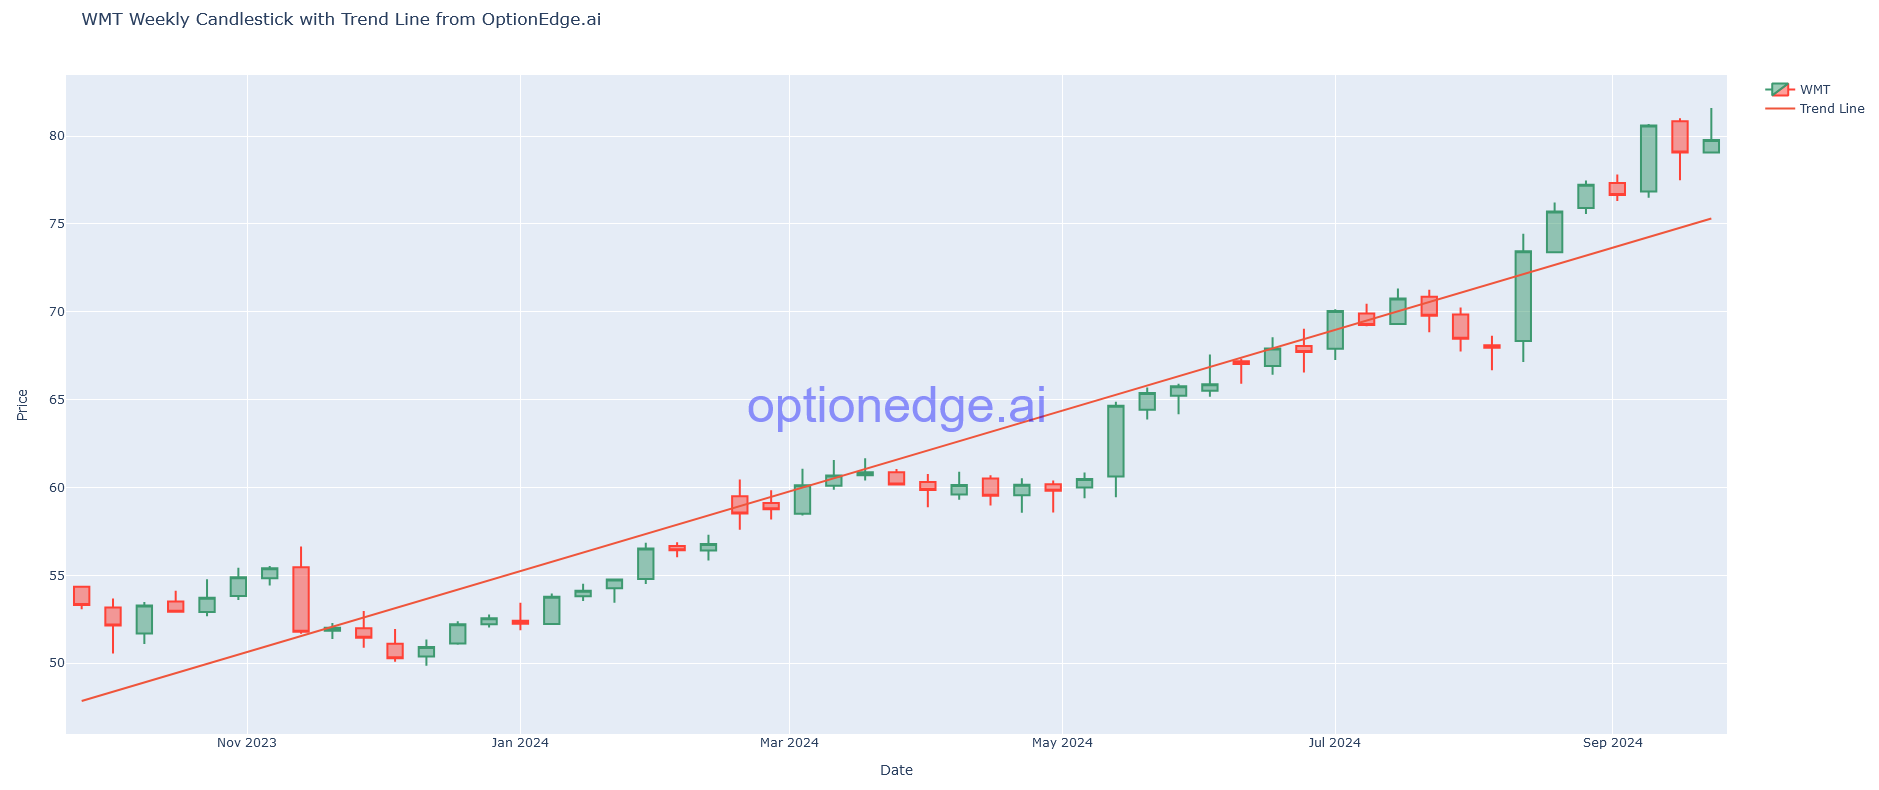
- Walmart (WMT): The weekly candle indicates that WMT is gaining momentum and holding above the trendline. Like Costco, Walmart tends to perform well in October.
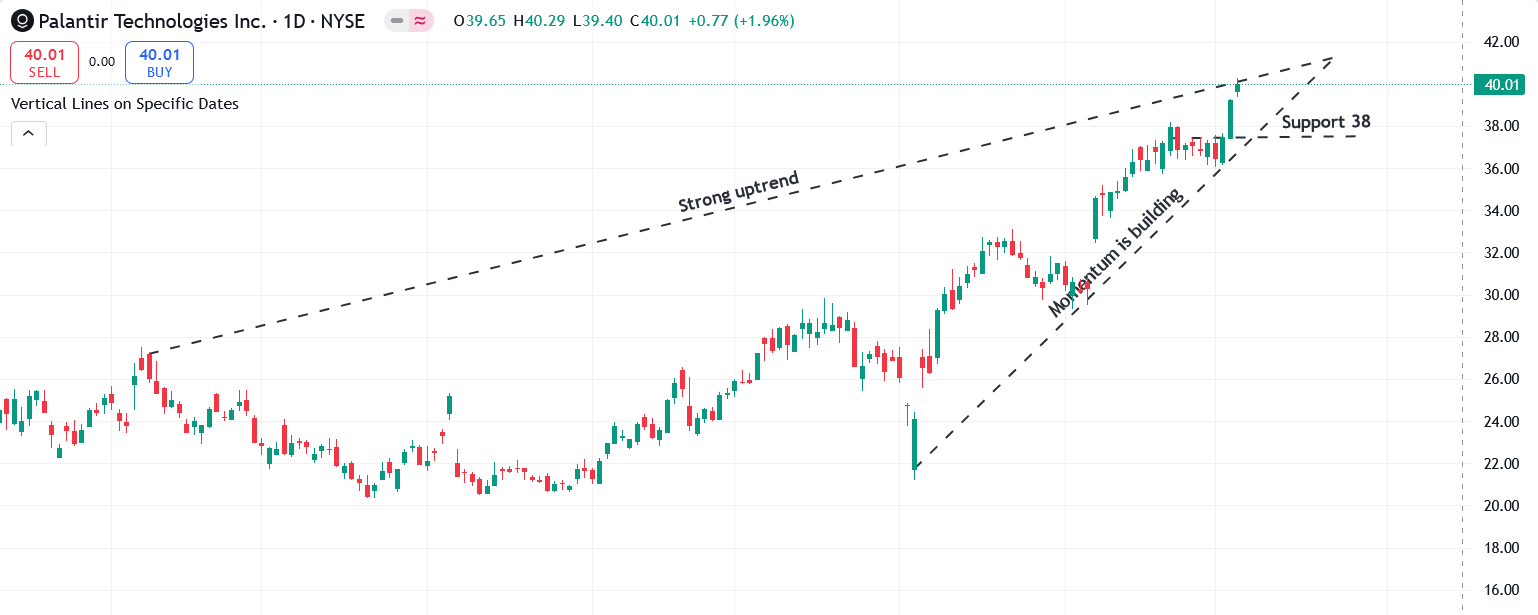
- Palantir (PLTR): As noted last week, PLTR’s uptrend remains intact. Strong support at 38 suggests potential for it to rise to 45-48 by year-end.
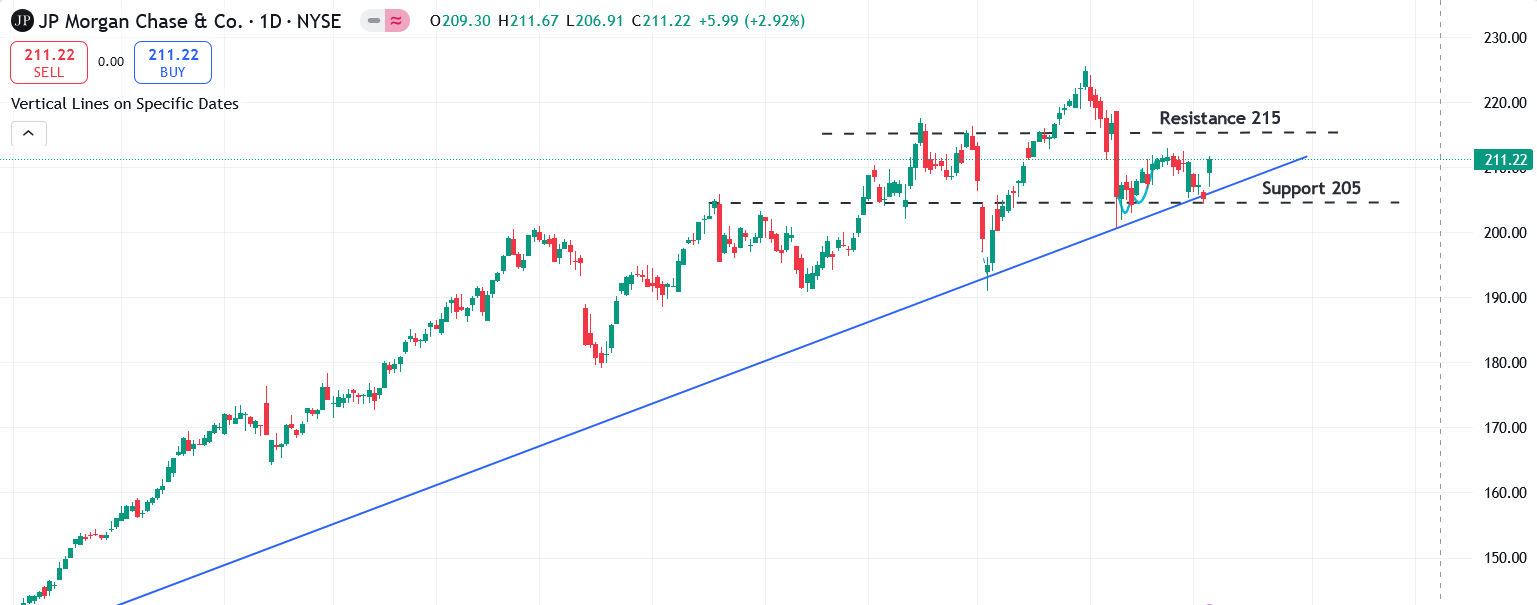
- JPMorgan (JPM): Technical indicators are weak, with stochastics turning bearish. We expect continued weakness in financials next week. With yields continuing to rise, JPM could find support at 205.
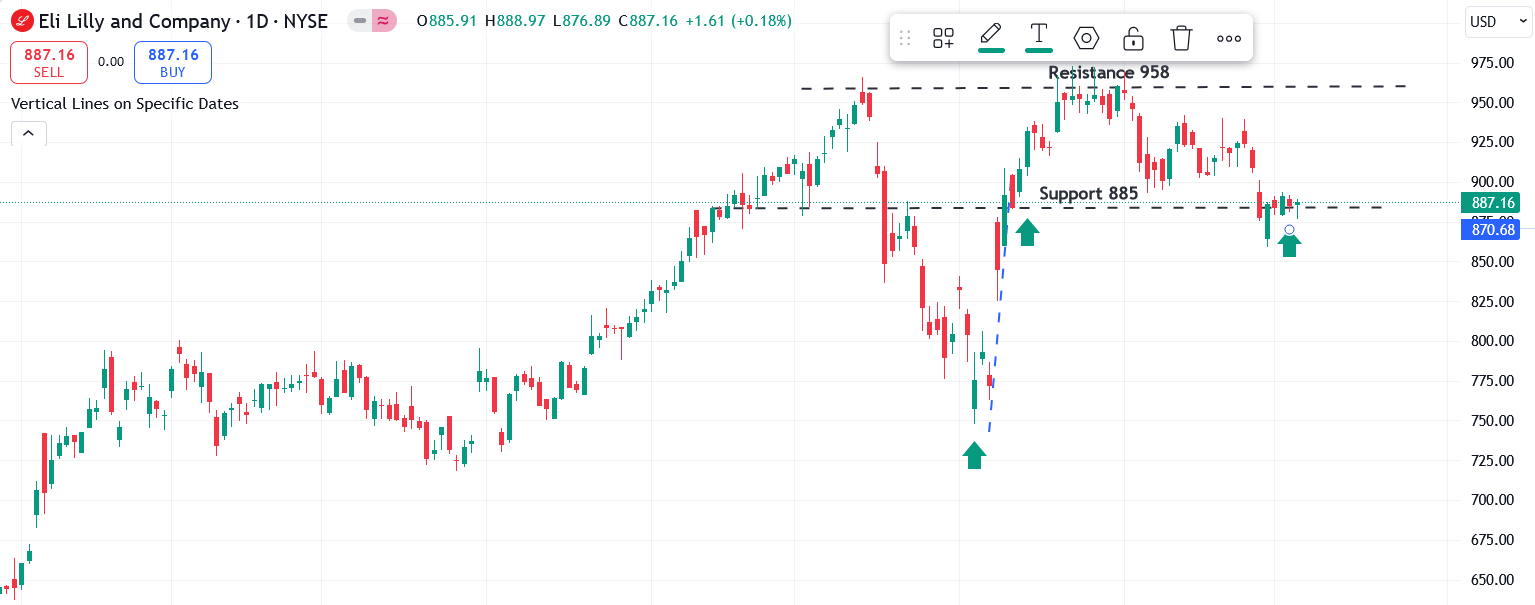
- LLY: LLY has been trading within a channel and is currently resting at the bottom of it. We expect it to resume its uptrend towards the 950 area over the next month. Historically, LLY performs better when the broader market declines for any reason.
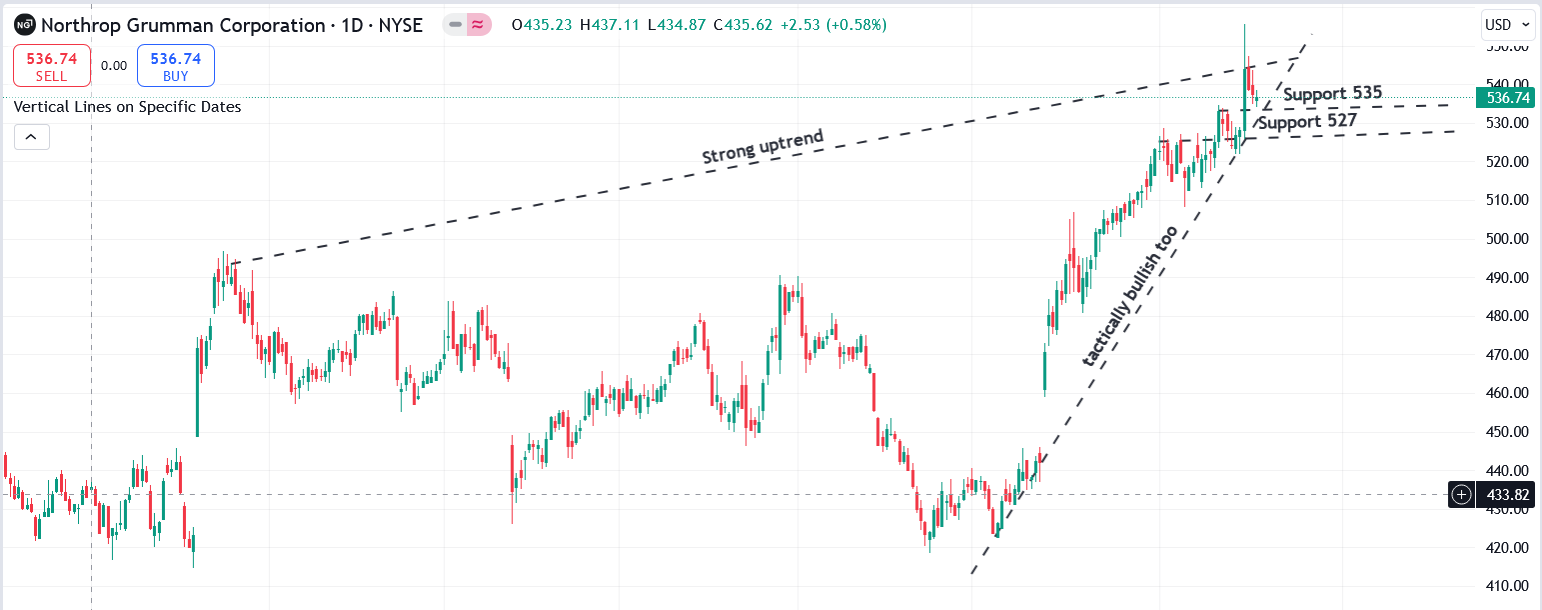
- NOC: The technicals for NOC are bullish. With ongoing geopolitical conflicts, Northrop Grumman tends to rise steadily. Global tensions rarely subside quickly, and as one conflict ends, another often begins elsewhere. This environment supports continued upward momentum for NOC.
🔥 Featured Trade Idea: SPY 🔥
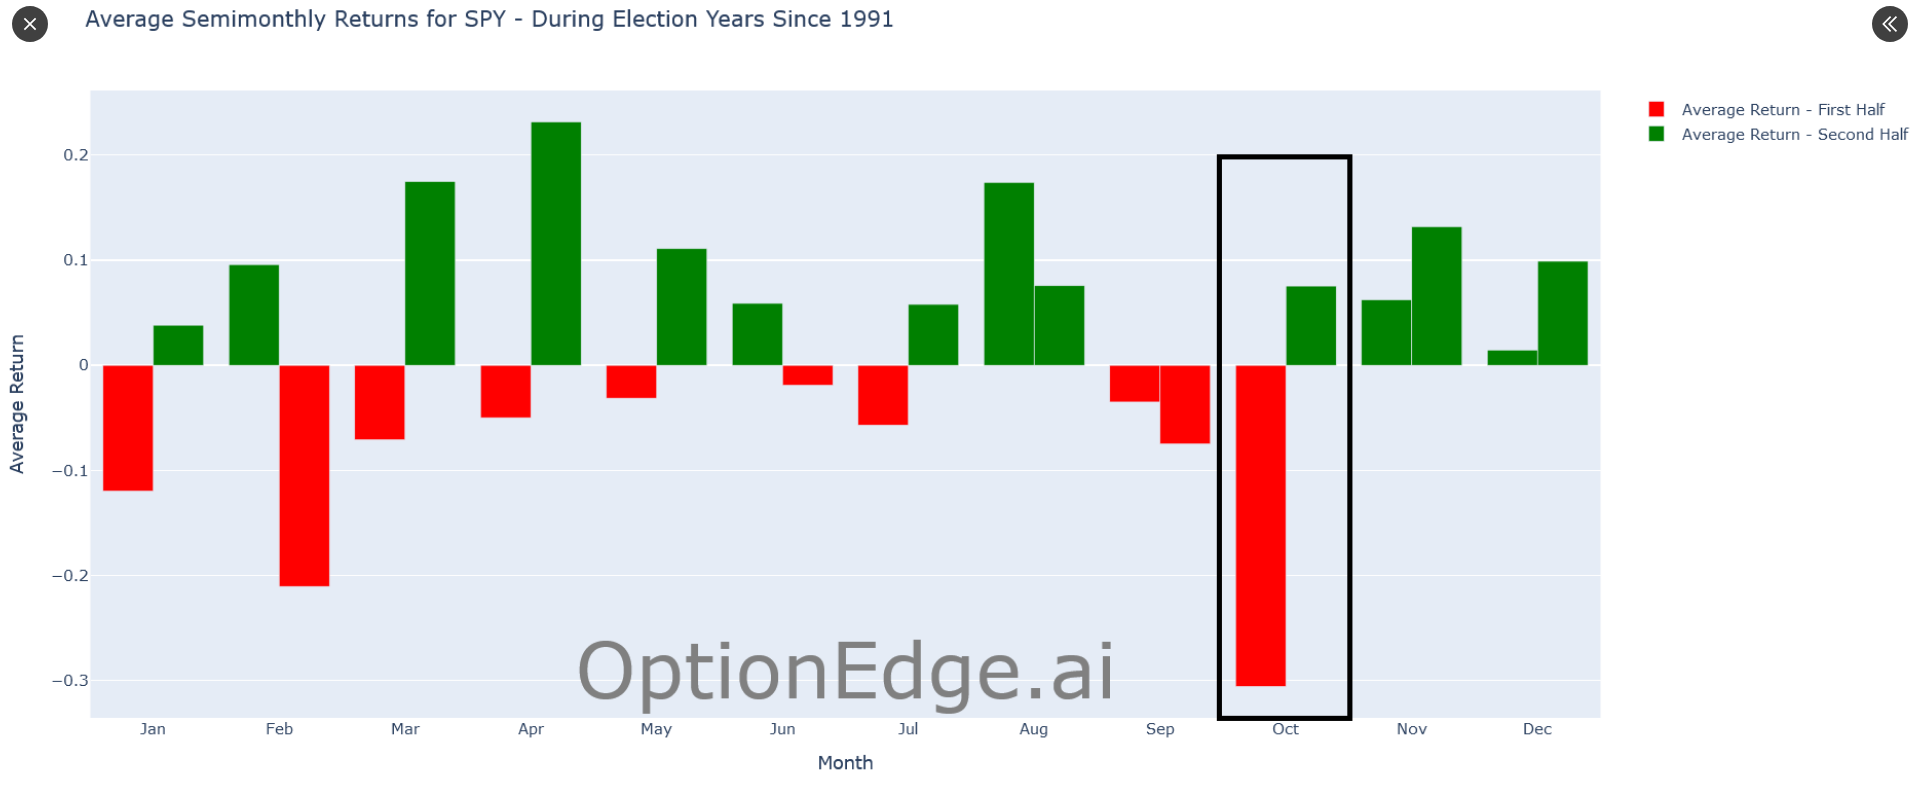
Rationale: Historically, the average return for the first half of October during election years has been poor. However, our AI Quant model expects SPY to remain volatile, with the potential to test levels of 565, 556, and 550 within the next two weeks.
💡 Trading Tip of the Week: Harnessing the Power of "Covered Calls" for Income Generation 💡
Consider implementing a "Covered Call" strategy to generate extra income from your stock holdings. This options strategy involves selling call options on stocks you already own, allowing you to collect premium income. If the stock price stays below the strike price, you keep the premium and your shares. However, if the stock price exceeds the strike price, your shares may be called away, but you'll still profit from the premium and any capital appreciation up to the strike price.
This research is intended for OptionEdge AI clients only.
OptionEdge AI subscriptions are limited to a single user, and this research must not be shared, redistributed, or disclosed to others. For more information, please contact support@optionedgeai.com.
Conflicts of Interest
This research reflects the views, opinions, and recommendations of OptionEdge AI. At the time of publication, OptionEdge AI has no knowledge of any material conflicts of interest related to this content.
General Disclosures
OptionEdge AI is an independent research firm and is not registered as an investment advisor or broker-dealer under any federal or state securities laws.
This communication is issued by OptionEdge AI for informational and educational purposes only. It is not a personal recommendation, offer, or solicitation to buy or sell any securities, financial products, or services. This material should not be considered legal, tax, accounting, or investment advice. It is not prepared in compliance with legal requirements to promote the independence of investment research and is not subject to any prohibition on dealing ahead of its dissemination.
This document is intended solely for the recipient and may not be distributed without the prior consent of OptionEdge AI.
Copyright © 2024 OptionEdge AI. All rights reserved. No part of this material may be reprinted, sold or redistributed without the prior written consent of OptionEdge AI