Hello! We're excited to bring you this midweek (Wednesday) edition of top trade ideas and market insights. Stay ahead with OptionEdge.ai! 🚀
Welcome to Your Midweek Insights 🎯
Wednesday's Trading Updates and Opportunities
By OptionEdge.ai
Exclusive Premium Content
This content is exclusive to premium members.
Market Recap
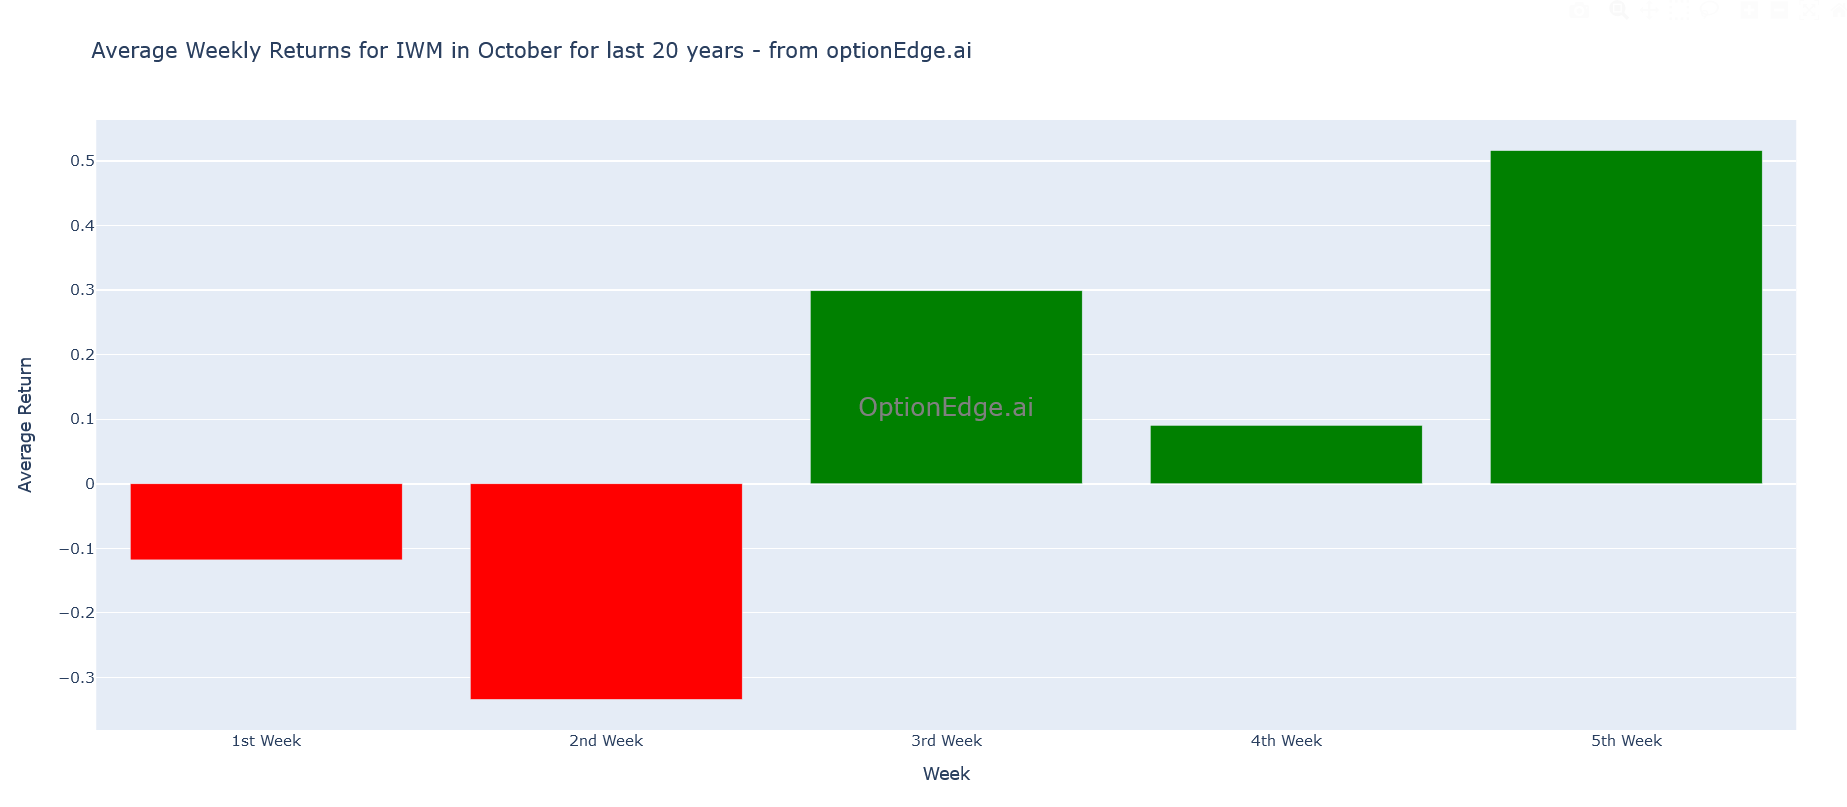
As anticipated, October kicked off with heightened volatility. We expect the market to experience further fluctuations until mid-October. Historically, the first half of October in election years tends to be rough. We're focusing on solid setups for new trade opportunities.
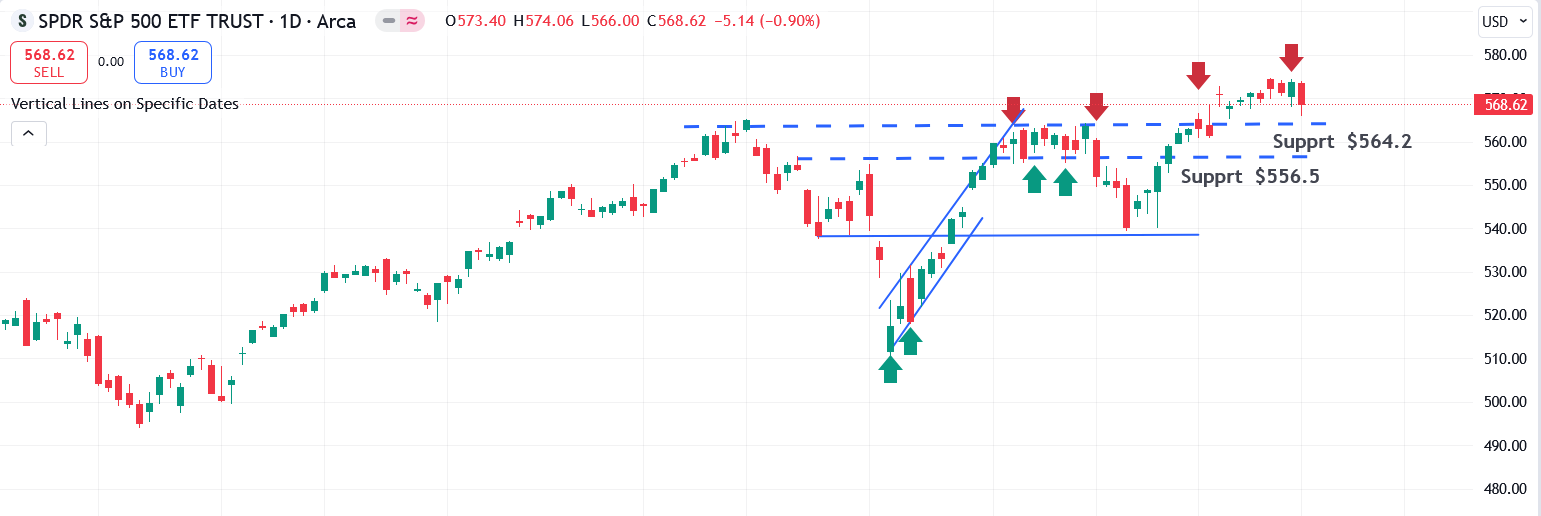
- SPY (S&P 500 ETF): SPY began October by dipping but recovered from its lows. Upcoming payroll data will be critical, and we expect continued volatility regardless of the report. A strong jobs report could reignite inflation concerns and delay Fed rate cuts, while a weak report might shift the focus to earnings worries. Either way, uncertainty is likely to keep the market on edge.
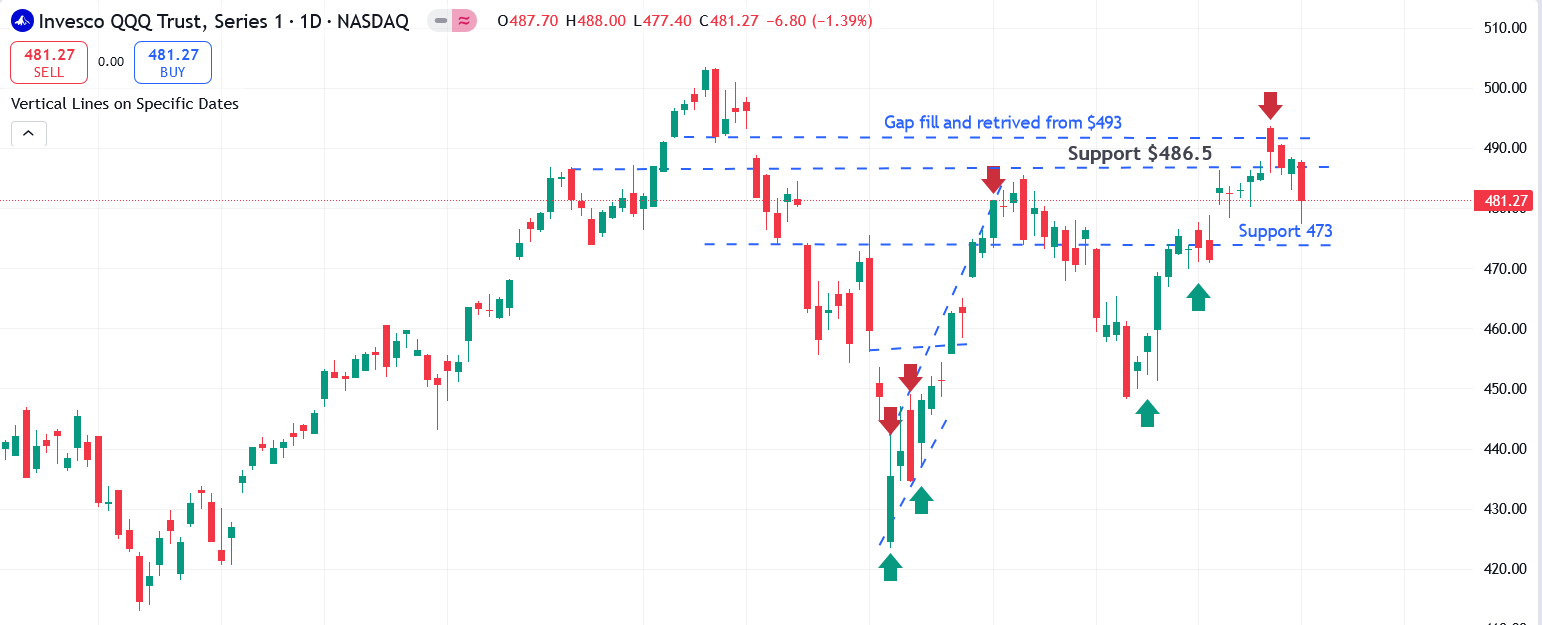
- QQQ (Nasdaq 100 ETF): QQQ performed worse than the broader market, as predicted. AAPL has given back all of its gains from Monday. Historically, the first week of October is tough for AAPL. We remain bullish on META, TSLA, and GOOGL for better setups.
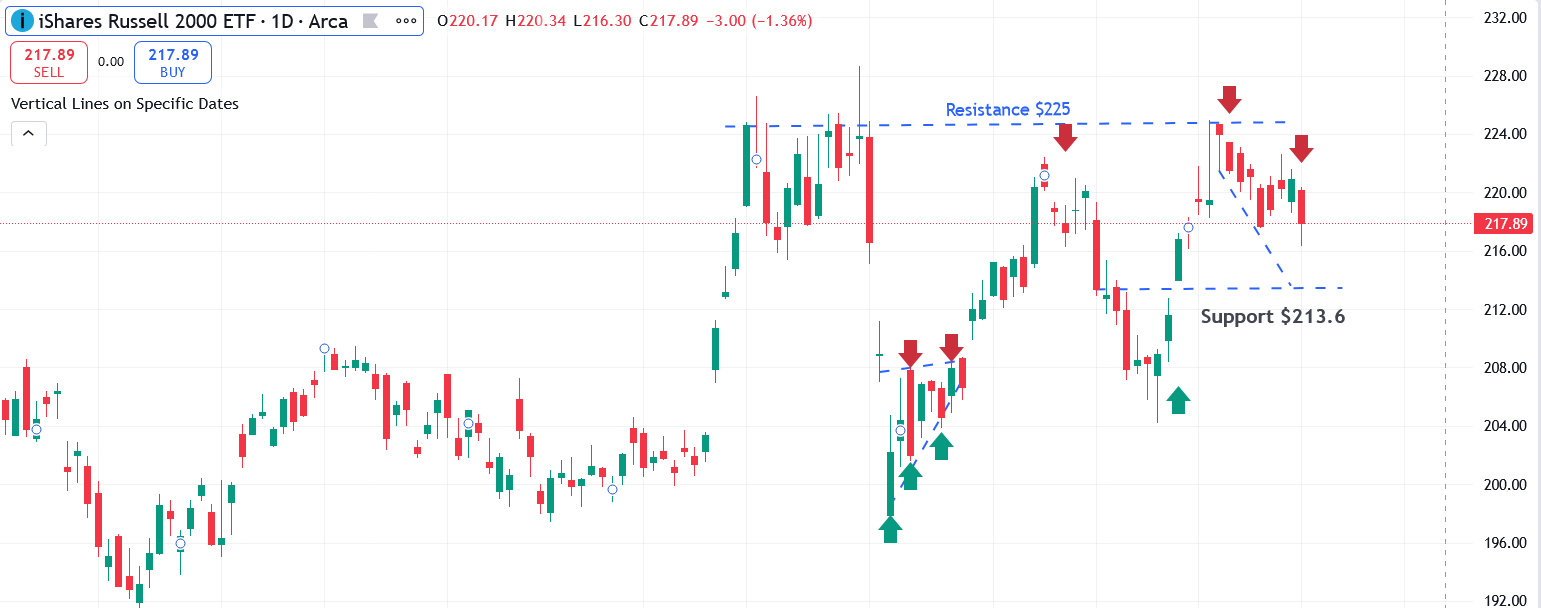
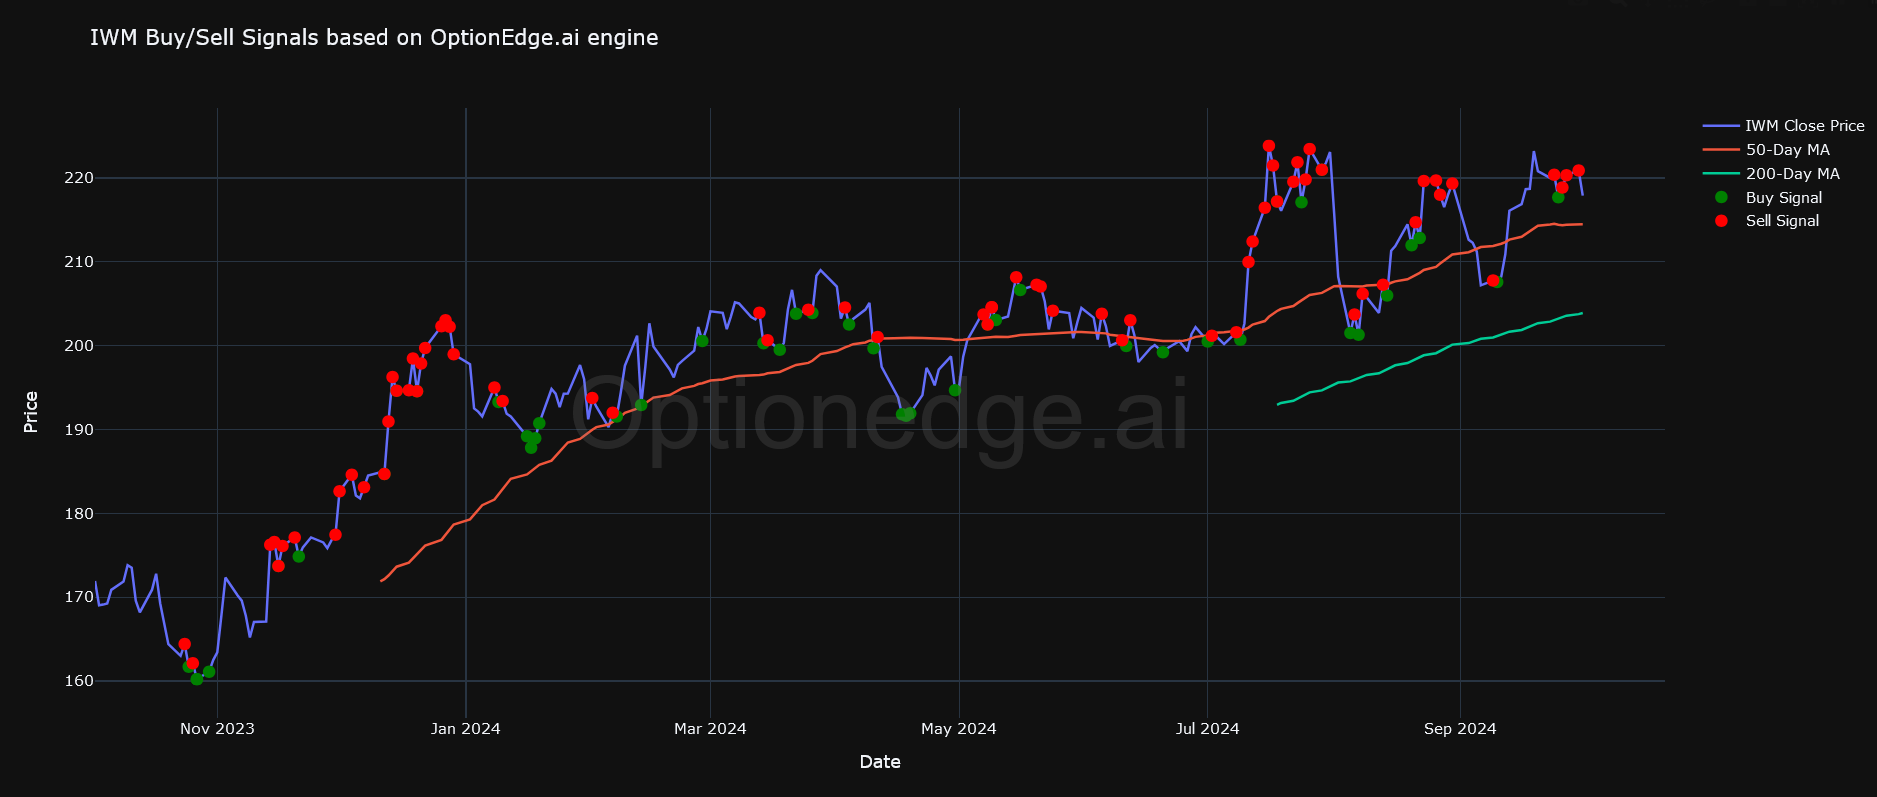
- IWM (Russell 2000 ETF): Regional banks, which make up nearly 10% of the index, tend to perform well in a low-interest-rate environment. However, the lack of clarity on future Fed policy has made them volatile and bearish. Regional banks would impact IWM performance. Small caps lack momentum and are vulnerable to market fluctuations. We expect IWM to test the 213 level in the next two weeks.
Action Plan for the Week
Looking ahead, the focus will be on key economic data, especially Friday's jobs report. We remain bearish on semiconductors, energy, financials, and commodities like GLD.
We’ve identified promising setups for Big Tech names like MSFT, GOOGL, META, and TSLA. We’ve recently closed successful put positions on SPY, IWM, and AMD, all of which hit their targets.
For October, we’re focusing on sectors that traditionally perform well, such as retail (COST, WMT) and communication services (GOOGL, META). Health insurance companies like UNH also tend to do well this month.
Featured Trade Ideas
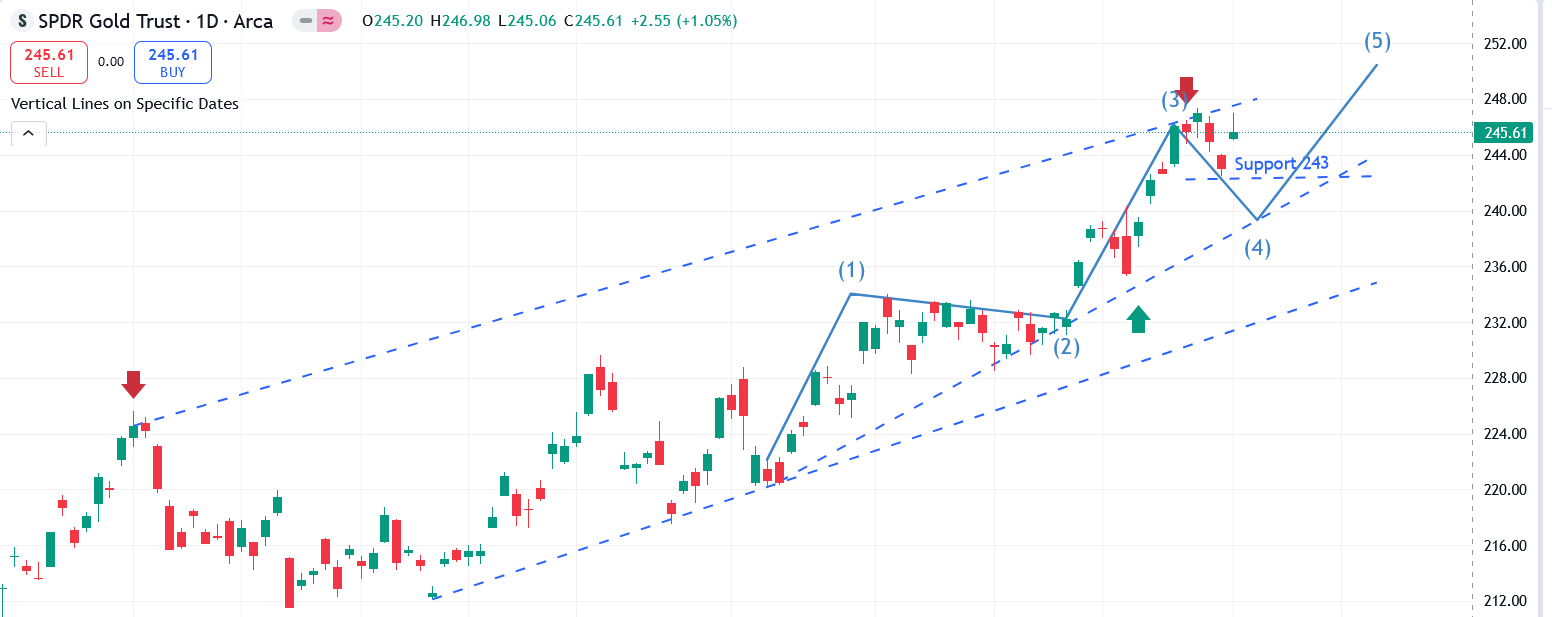
- Gold (GLD): Historically, GLD underperforms during the first week of October. We’ve initiated a put position on Gold, expecting it to enter a wave 4 pullback before resuming an uptrend in wave 5 (per Elliott Wave analysis).

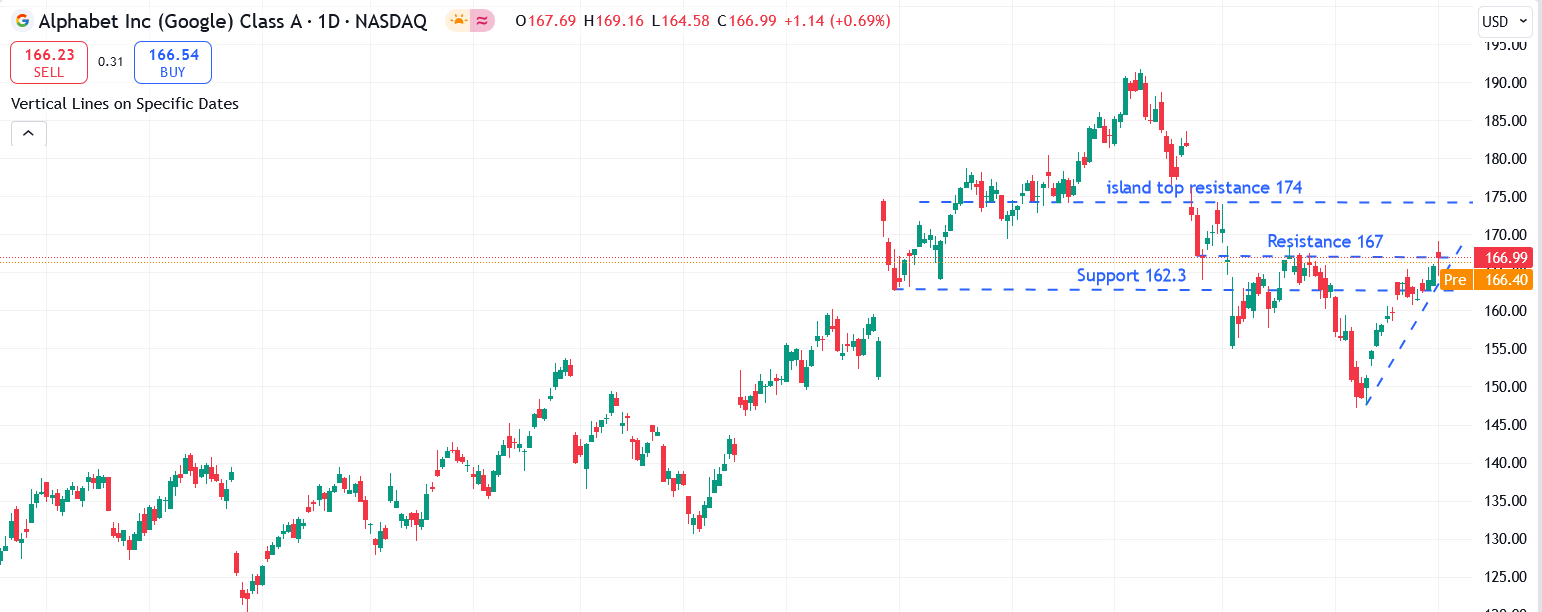
- GOOGL: GOOGL is hovering near a resistance level. If it breaks out, a long position could be considered.
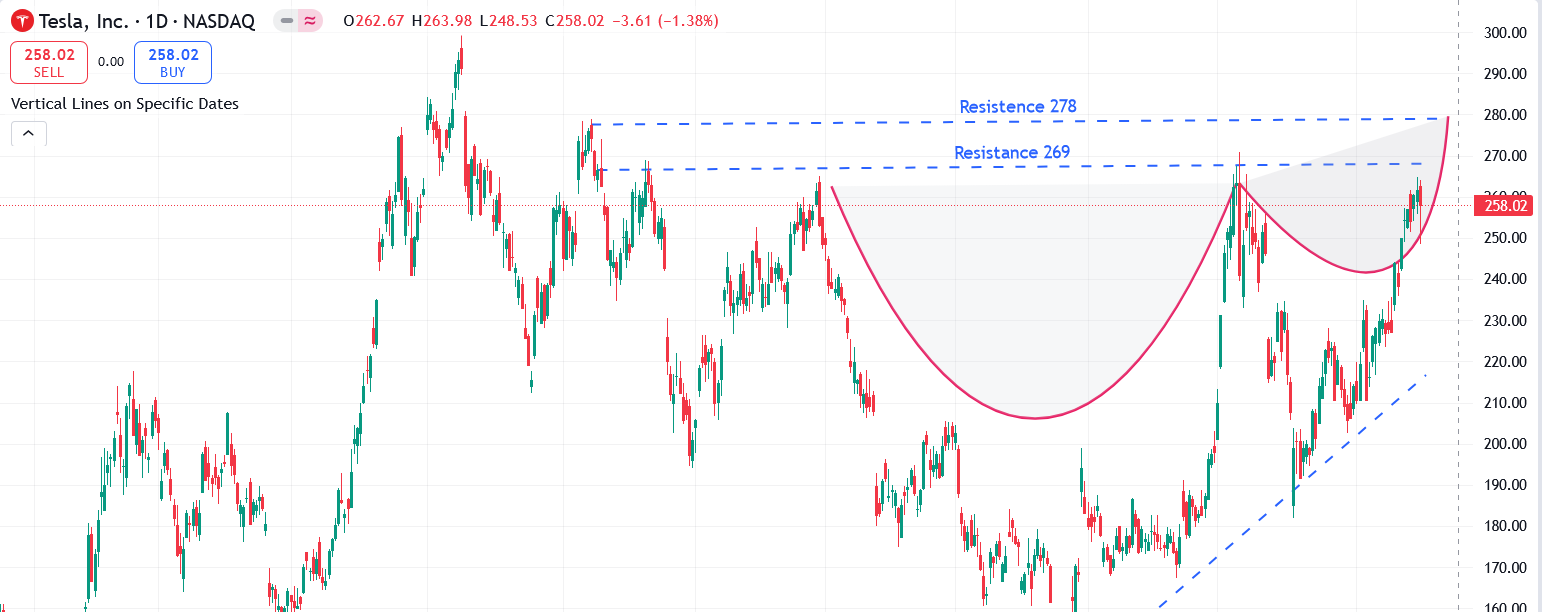
- TSLA: TSLA's delivery numbers are expected today, and we anticipate a resurgence. The excitement around Full Self-Driving (FSD) technology could drive further consumer interest. As a "Trump trade," TSLA could see upside in the coming weeks.
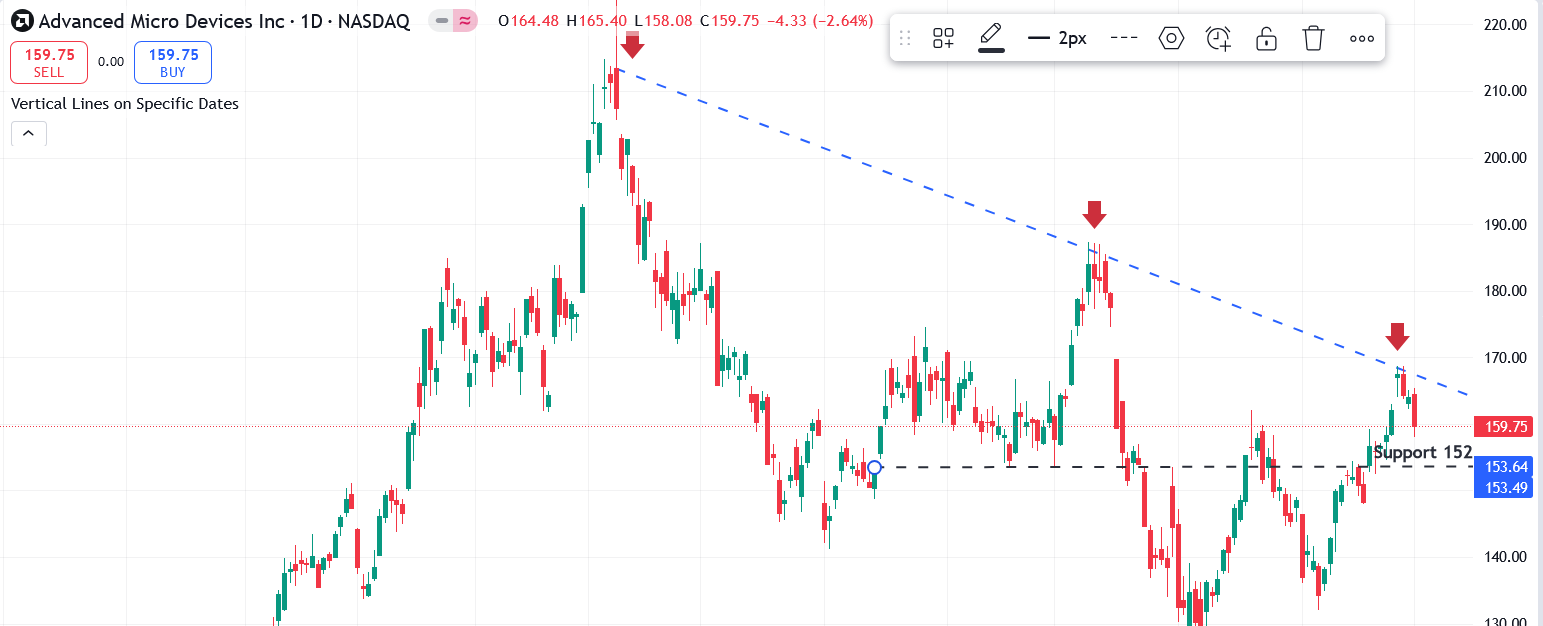
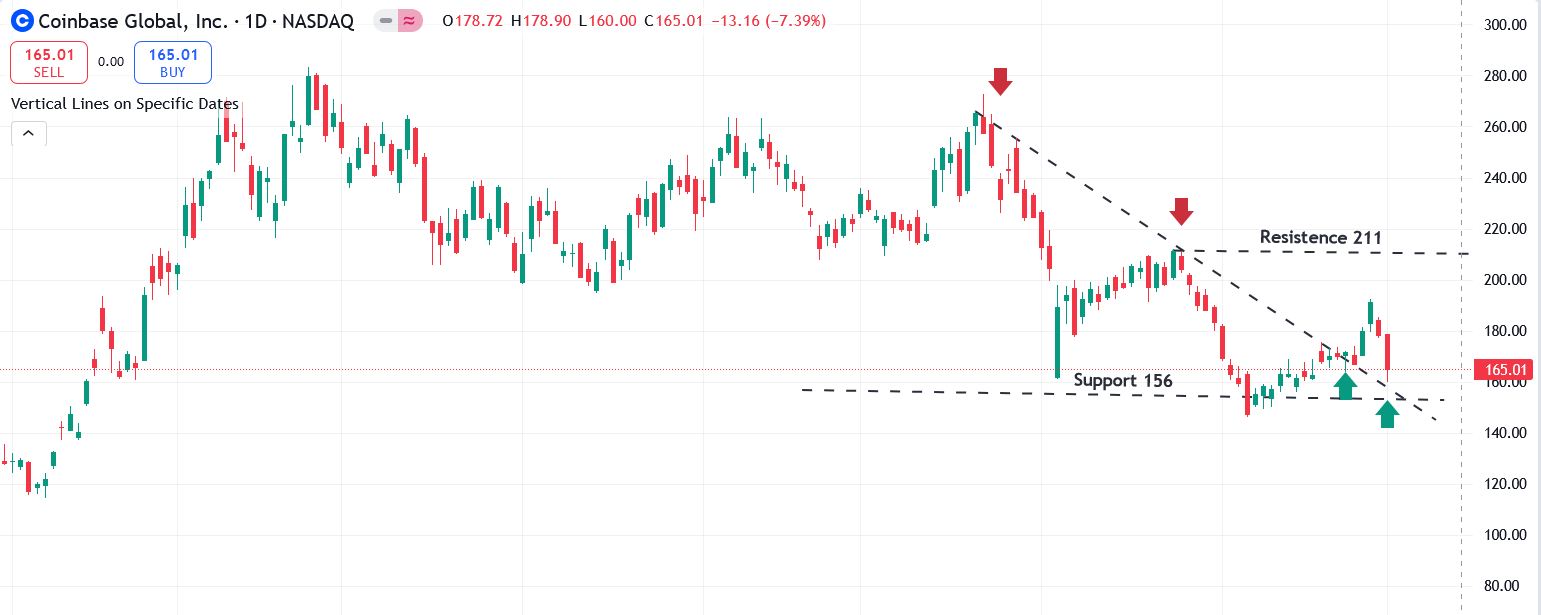
- AMD: Semiconductors tend to underperform in the first half of October. Our quantitative model indicates that AMD is likely to find support near 156, with a bearish setup for now.
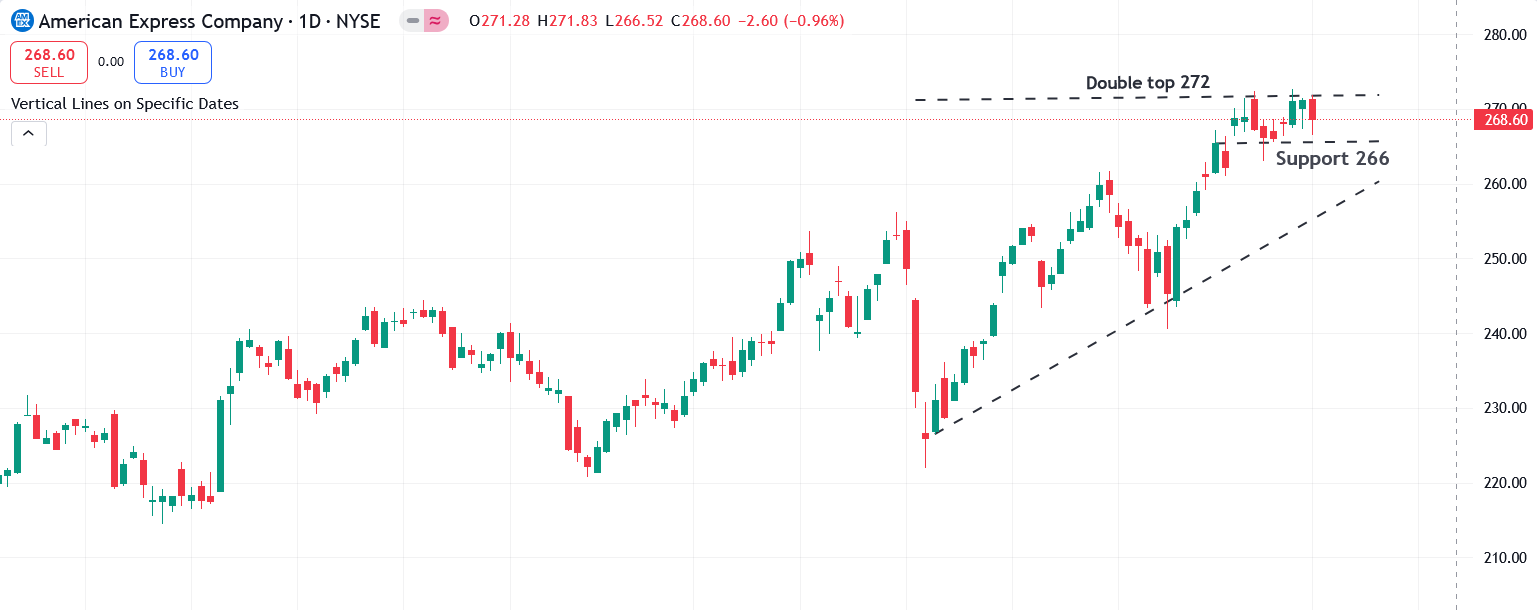
- AXP: We remain bearish on financials, and AXP is displaying a bearish engulfing pattern.
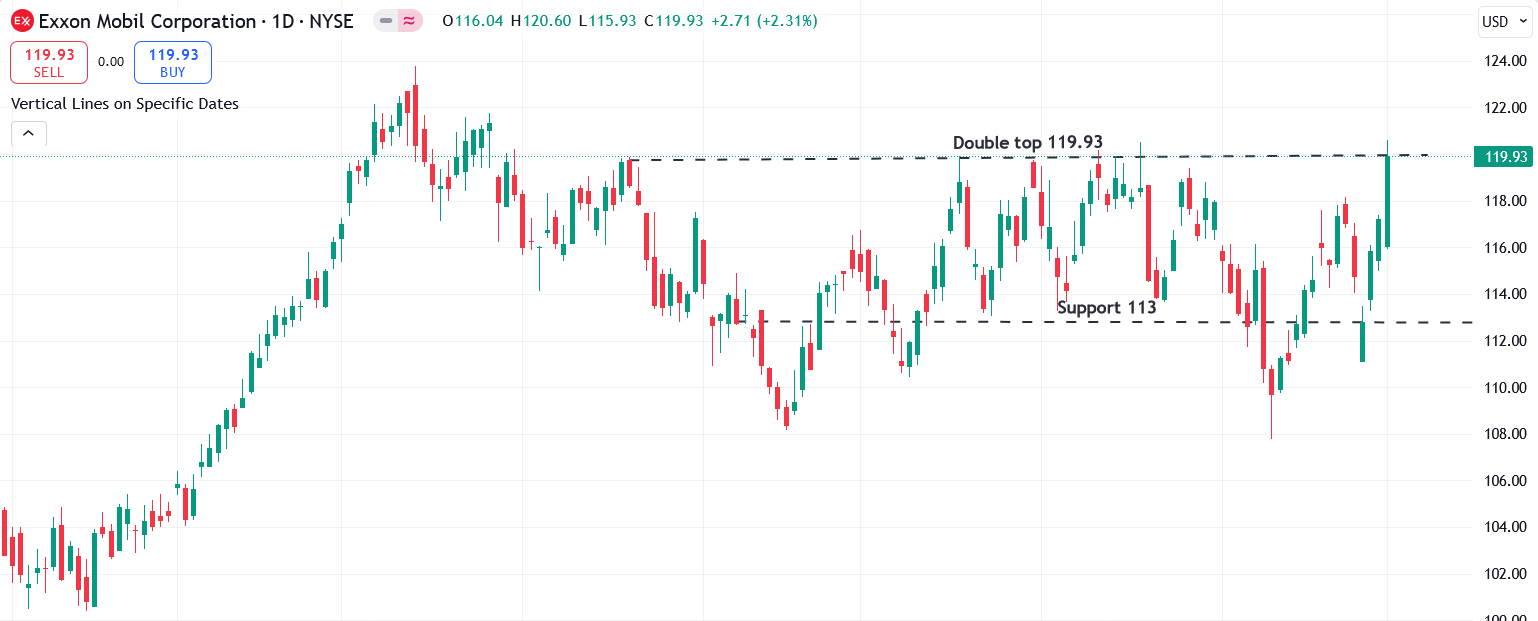
- XOM: A double top pattern is forming on XOM, indicating a bearish setup.
🔥 Featured Trade Idea: IWM 🔥
Rationale: Our AI quant model anticipates continued volatility in IWM, with a potential test of 213–215 levels over the next two weeks. Given the uncertainty around inflation and payroll data, caution is advised.
💡 Trading Tip of the Week: Mastering "Trailing Stops" for Risk Management 💡
Strategy: Use Trailing Stops to protect profits and limit losses in volatile markets. A trailing stop automatically adjusts as the price moves in your favor, allowing your trade to remain open and capture more gains. If the price moves against you by a specified amount, the trailing stop triggers an exit. This strategy helps manage risk while letting your winning trades run longer, especially during periods of unpredictable market swings..