Hello! We’re excited to bring you this week’s top trade ideas and market insights. Stay ahead with OptionEdge.ai! 🚀
Welcome to Your Weekly Edge 🎯
Weekend Update on Trading Insights and Opportunities
By OptionEdge.ai
Exclusive Premium Content
This is content that only premium members can access.
Market Recap
For the week ending September 27, 2024, the markets gave mixed signals, creating a cautious yet hopeful sentiment.
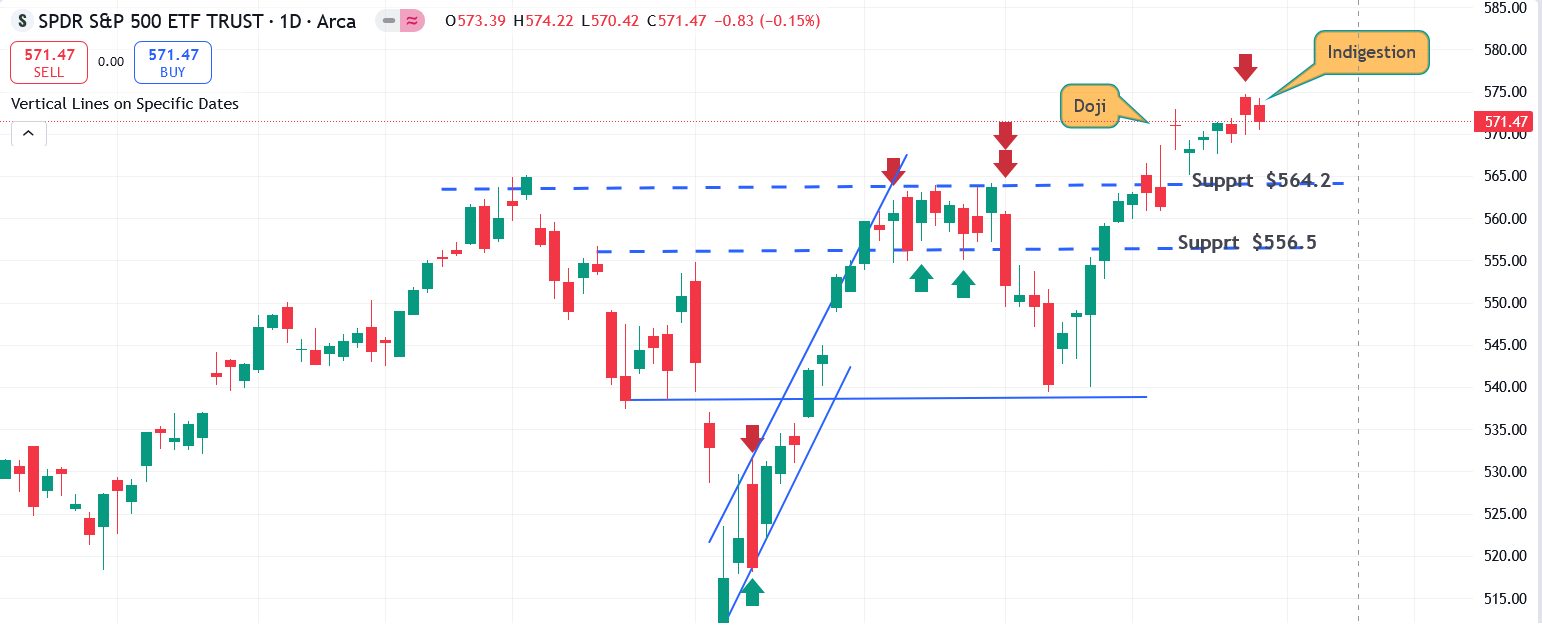
- SPY (S&P 500 ETF) hovered near its all-time high, supported by momentum from the Fed’s easing cycle and potential future rate cuts. However, a late-week pullback, driven by geopolitical tensions and the closely contested U.S. political landscape, introduced some uncertainty. Despite this, SPY remains near its all-time high (ATH), with investors closely monitoring new data to assess the Fed’s next moves. The chart shows a Doji pattern and signs of indecision, which may act as resistance, limiting further upward movement. For the week ending September 27, SPY gained 0.56%.
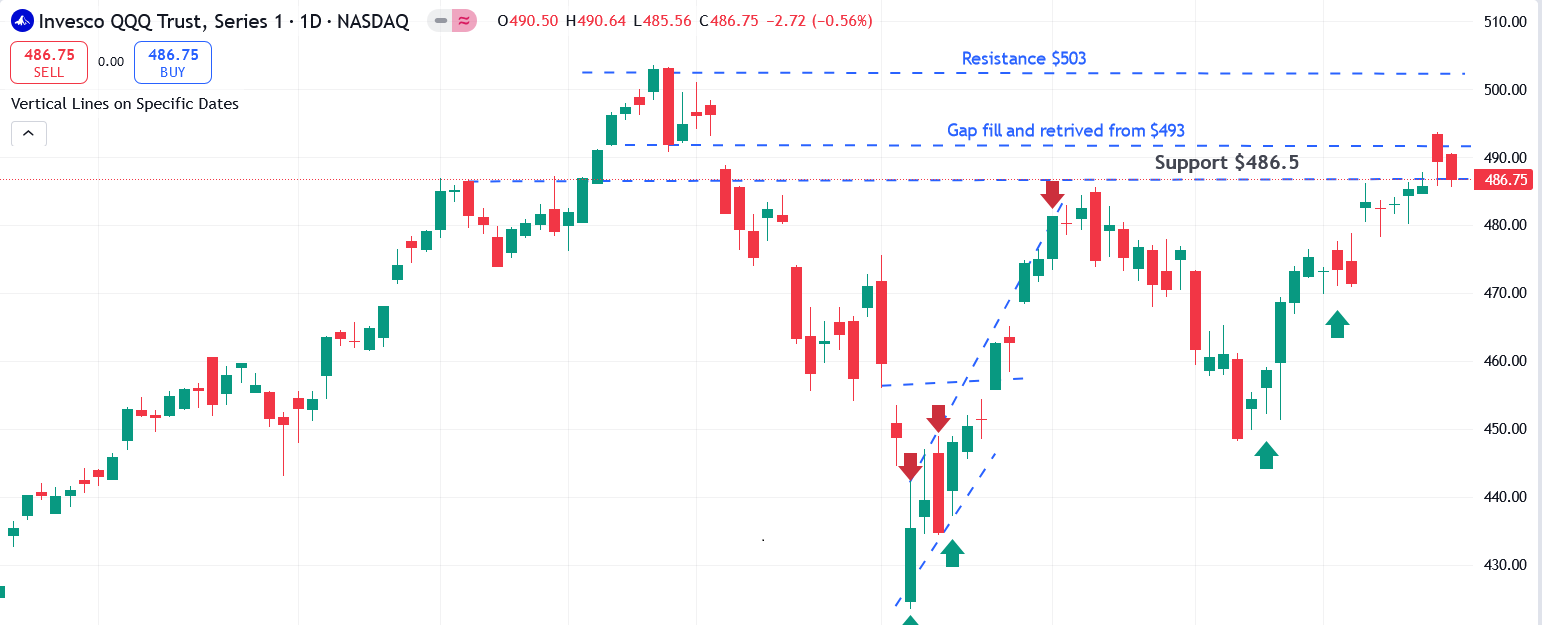
- QQQ (Nasdaq 100 ETF) experienced a volatile week. Tech stocks, which had previously surged on rate cut expectations, showed signs of caution. AI and semiconductor stocks like Nvidia and AMD saw some profit-taking, but the index remains in a long-term bullish trend. Concerns about high valuations and potential regulatory challenges continue to weigh on traders' short-term outlook. Additionally, new tariffs imposed on China last Friday have added to the uncertainty. For the week ending September 27, QQQ gained nearly 1%.
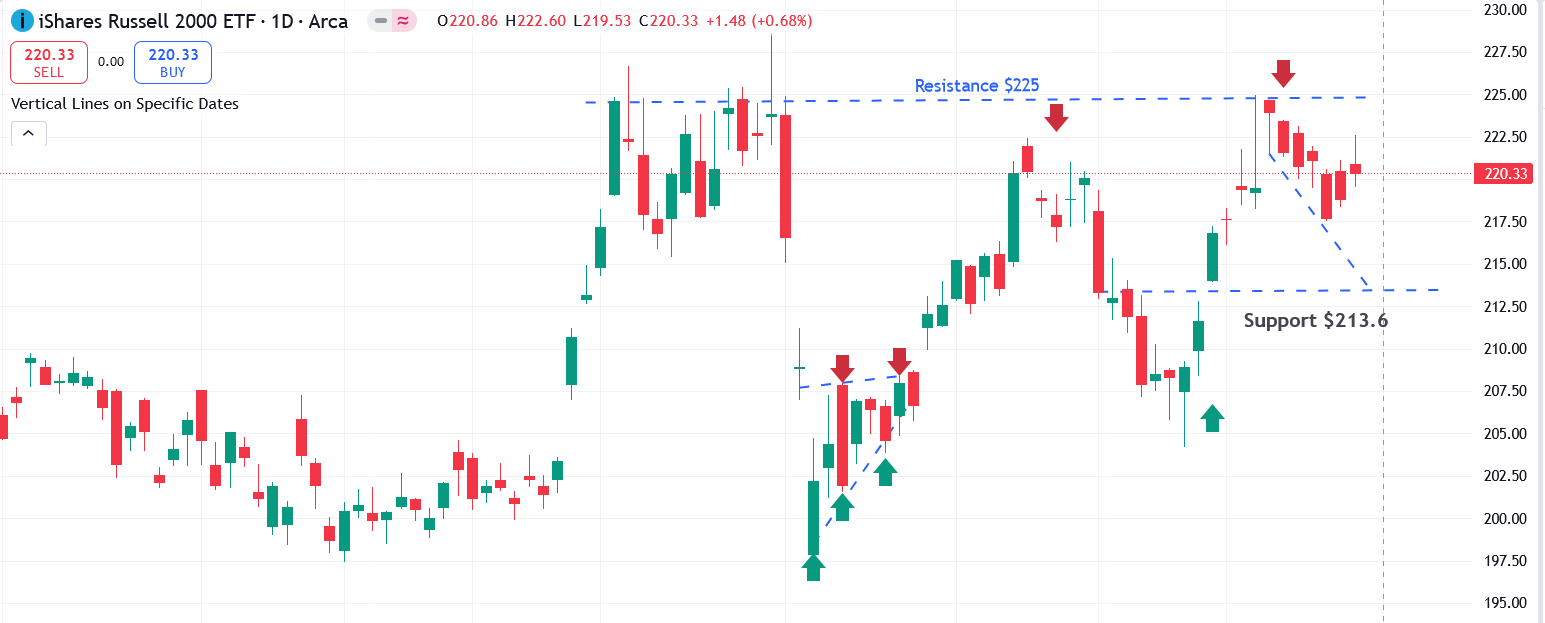
- IWM (Russell 2000 ETF) rebounded strongly, particularly in the latter half of the week. Small-cap stocks, which had lagged in recent months, outperformed as investor optimism about domestic economic growth improved. IWM is now positioned for a potential breakout if the economic outlook continues to brighten and rate cut expectations rise. For the week ending September 27, IWM was down by 0.2%.
As we predicted last week, we were aggressive on Big Tech calls and took advantage of Friday morning's market surge to close some positions. We remain bearish on Energy and Financials. Volatility remains high, especially with geopolitical tensions flaring up, and political policy announcements influencing short-term market movements. We recommend positioning in Big Tech again, as opportunities arise during market dips. While large tech stocks did well this week, they are now facing a consolidation period.
Next week action plan
Looking ahead, next week’s focus will be on key economic data, including the jobs report and the start of earnings season. Volatility is expected to remain high as investors respond to signals about the Fed's future policy decisions. Additionally, Gold (GLD) has been steadily rising, which could signal potential weakness in the broader market. Historically, the two weeks following a Fed pivot tend to be volatile and carry more downside risk. With the Fed's pivot on September 18th, expect volatility to pick up again starting October 2nd.
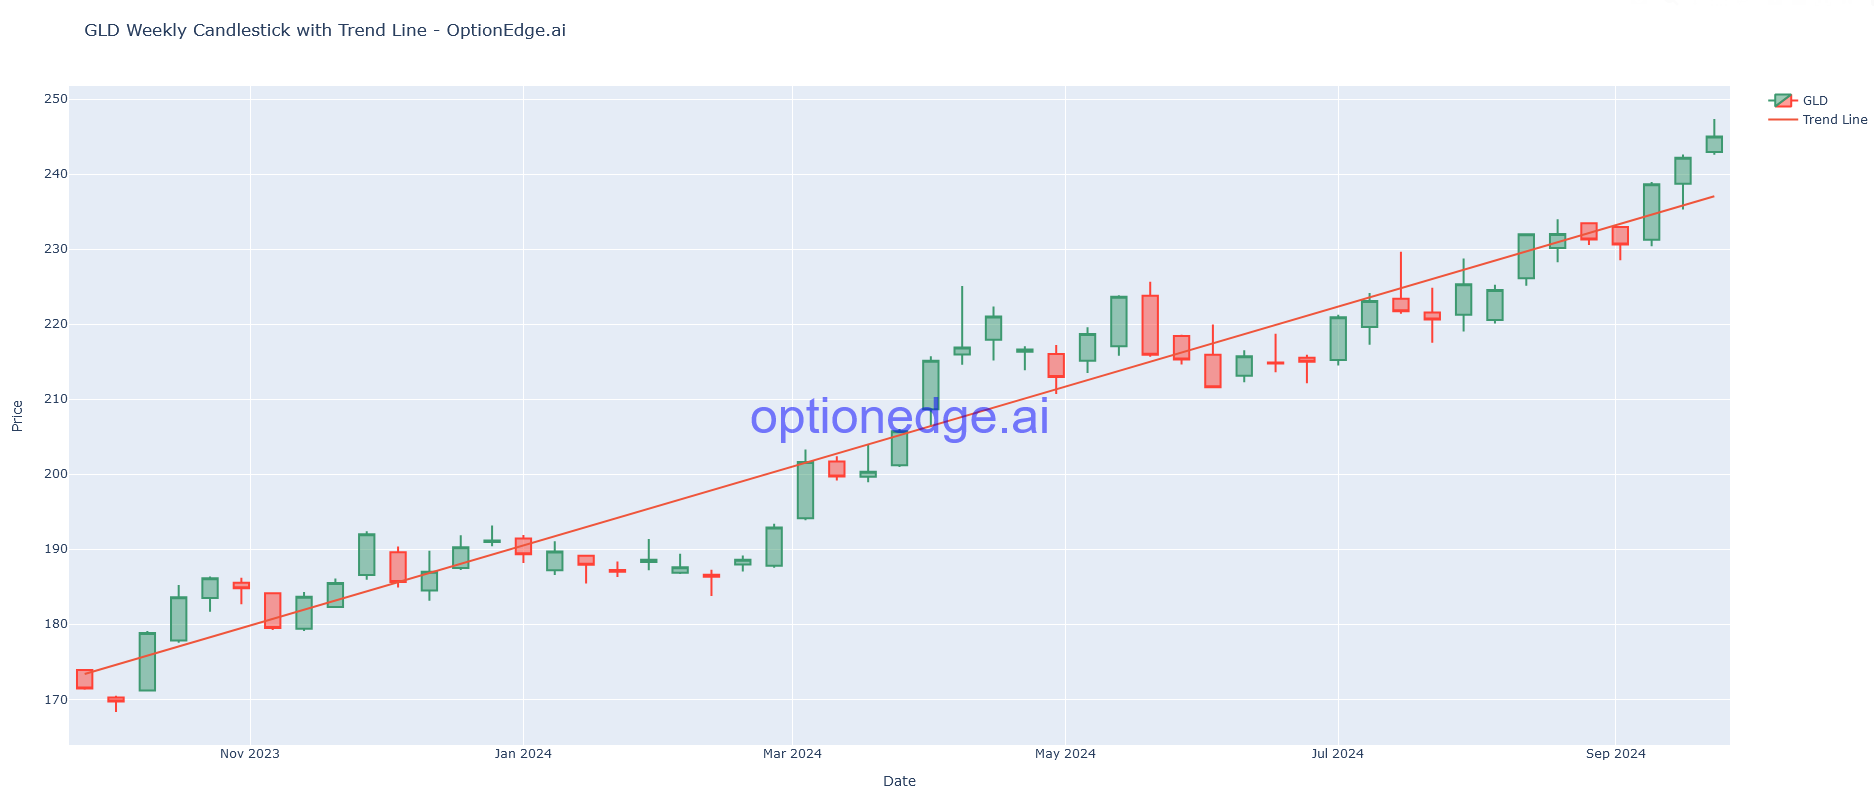
- Gold (GLD) continues its upward momentum as investors worry about the resurgence of inflation and the U.S. Dollar Index hovers near its yearly low. However, the weekly chart shows GLD deviating from its trendline, suggesting it may revisit the trendline in the coming weeks.
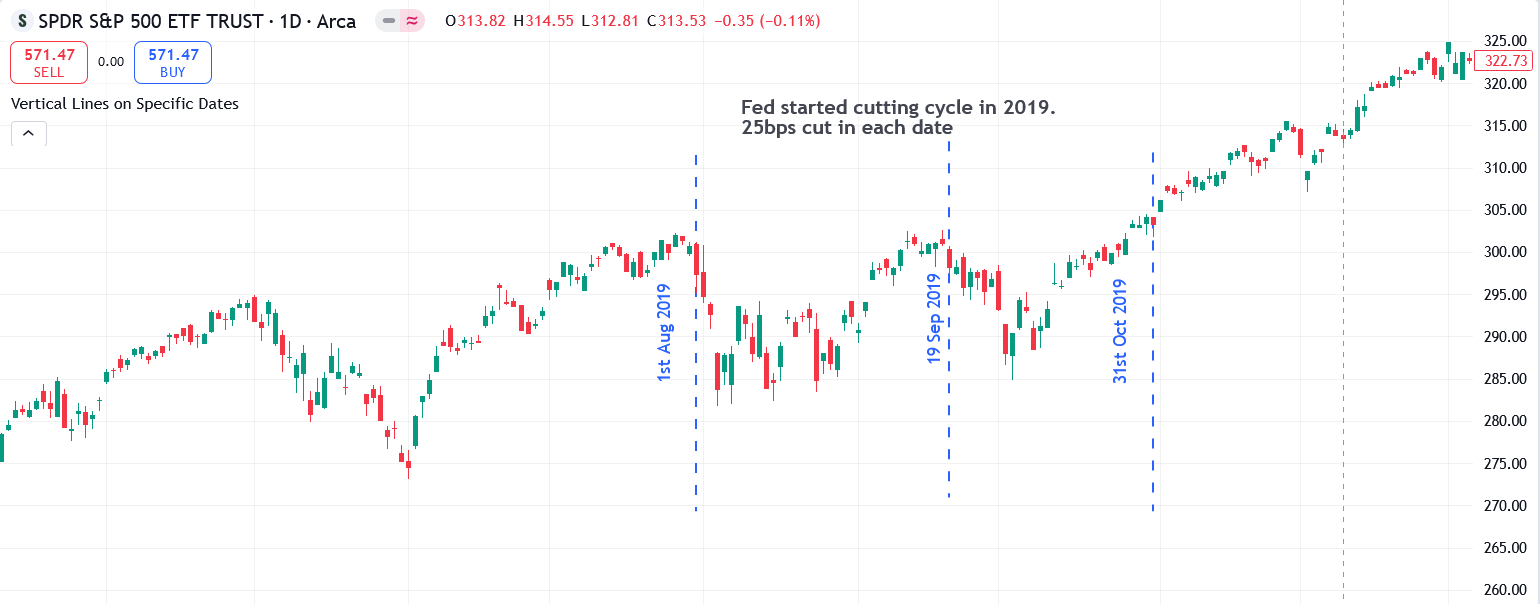
- SPY Looking back at SPY's performance in 2019, when the Fed initiated a rate cut cycle from August to October, the market experienced a dip and consolidation for about a month before the third cut in October reignited the upward trend. In 2024, we expect a similar pattern. The recent 50bps cut triggered a surprise rally, but we anticipate a 2-3% correction before the Fed’s easing cycle becomes more defined. Additionally, the upcoming closely contested election is likely to contribute to increased market volatility.
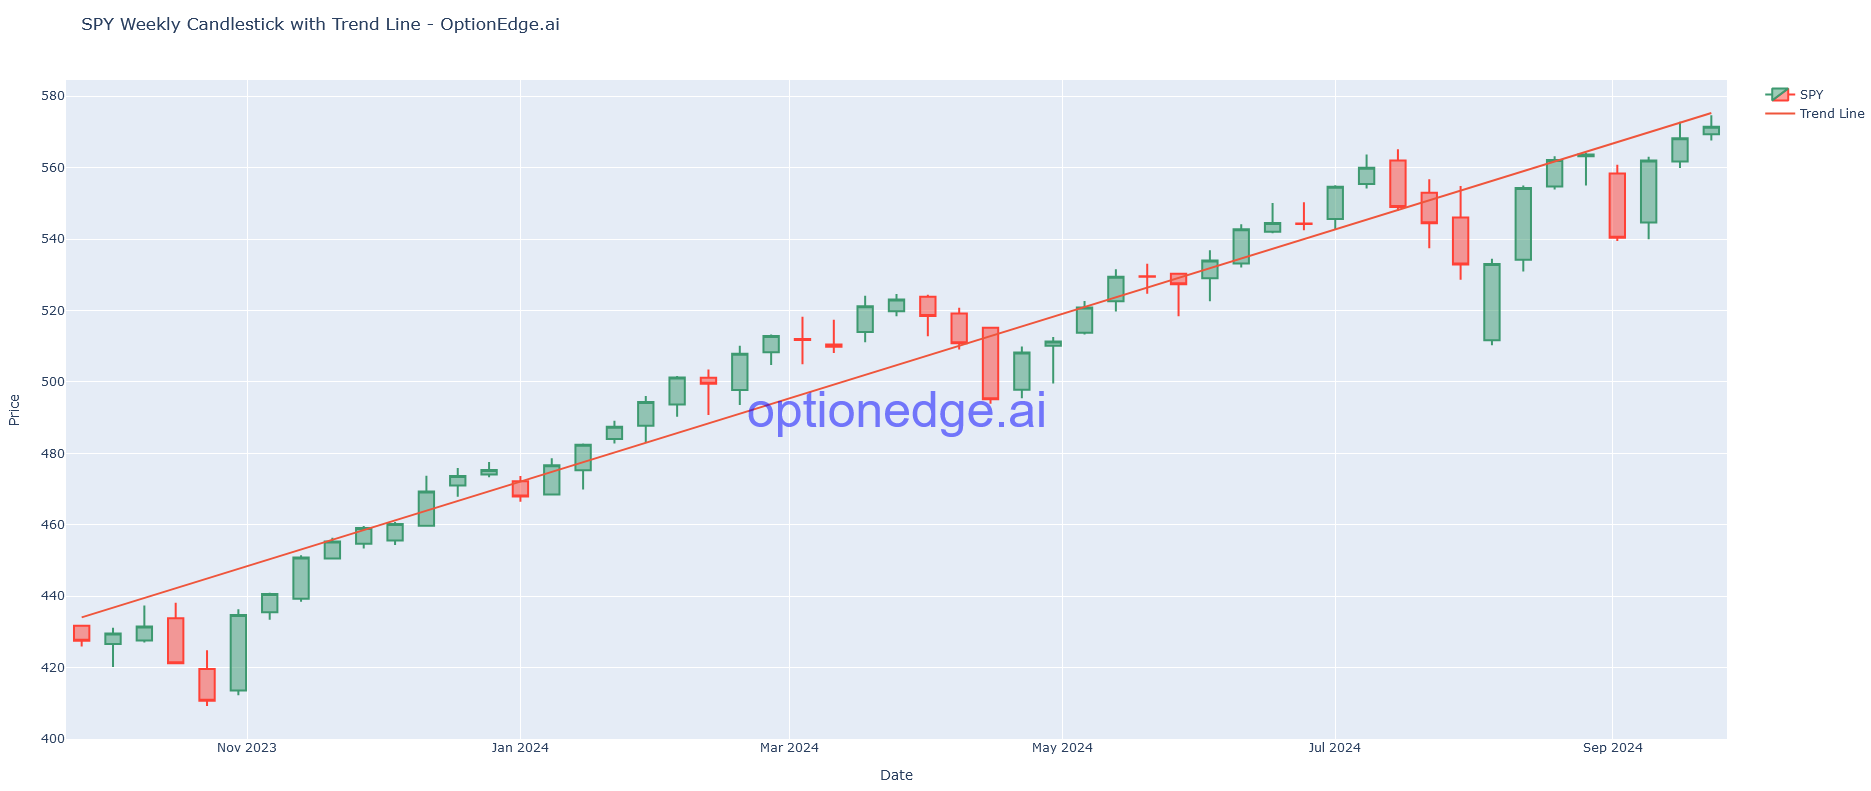
- SPY The weekly chart indicates that the broader market is hitting resistance and will likely retrace by 2-3% to consolidate before resuming its upward trend in November, heading toward year-end gains.
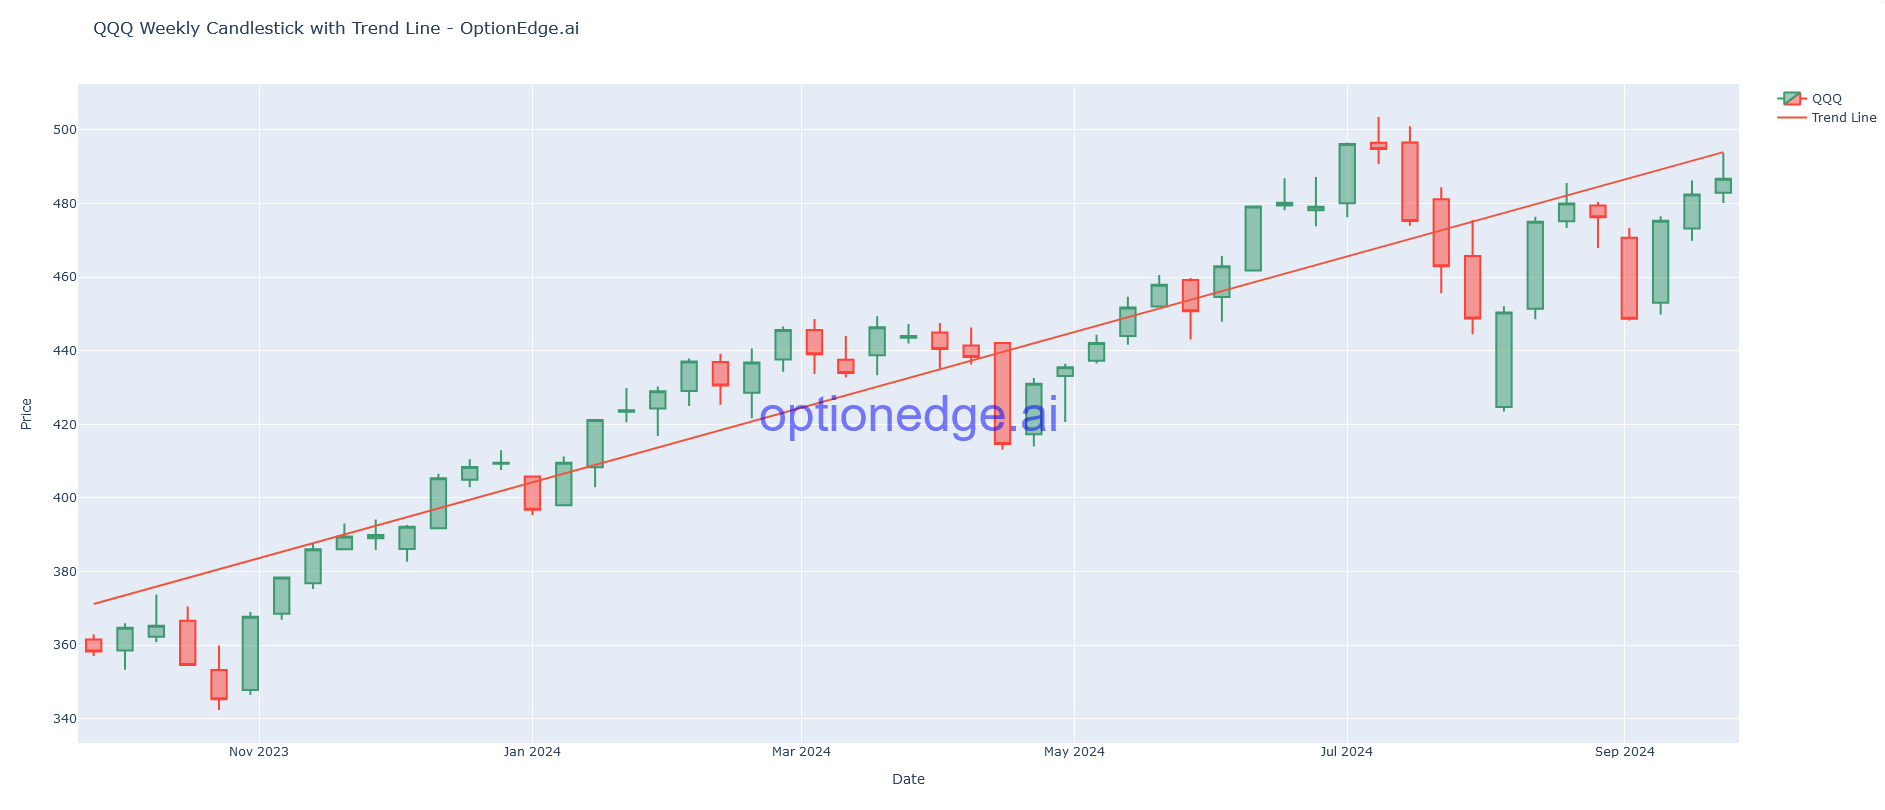
- QQQ The weekly chart suggests a similar retracement, with a likely 3% pullback ahead of earnings season. This dip presents an excellent buying opportunity ahead of the anticipated year-end rally. Currently, QQQ is below the trendline and may retest the 480 level, consolidating sideways until payroll data is released.
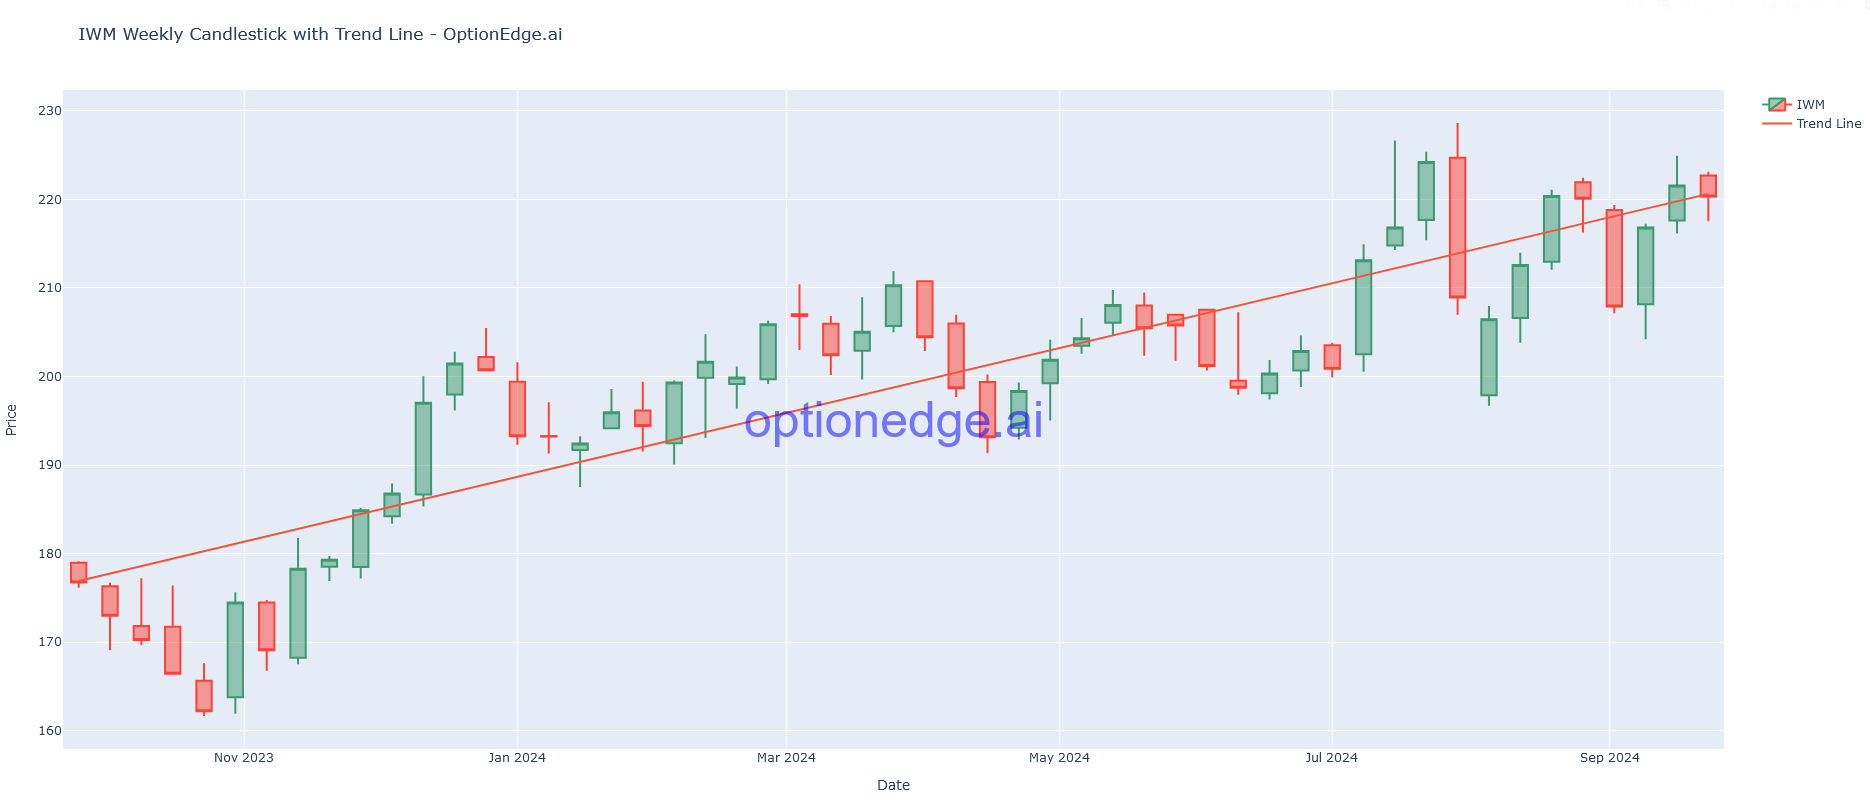
- IWM The weekly chart shows that IWM is sitting on its trendline. Small-caps are particularly vulnerable to any Fed policy missteps, so we expect consolidation around this level. However, if there is clarity in the Fed's future easing cycle, small-caps could rally higher. Typically, when IWM touches its trendline, it retests the week's lows within the following 5-7 trading days. Thus, traders should position carefully in this volatile environment.
Featured trade ideas
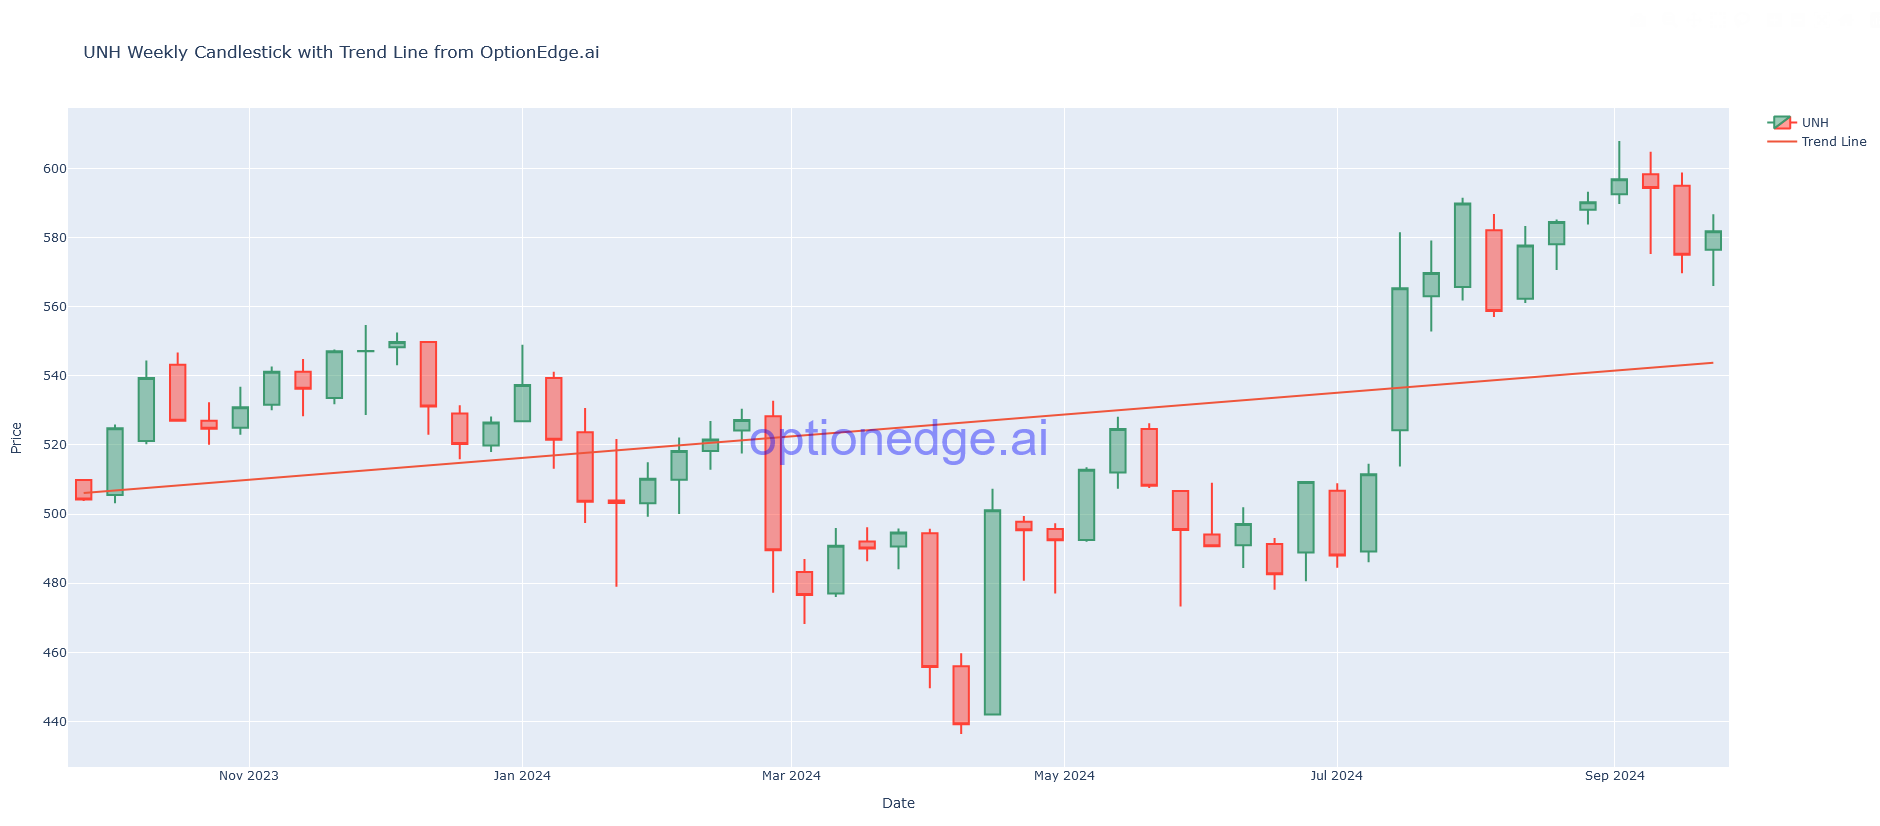
- UNH: The weekly candle indicates that it is maintaining momentum above the trendline. If the broader market experiences high volatility, UNH tends to move higher, and the first half of October is typically a strong month for UNH.
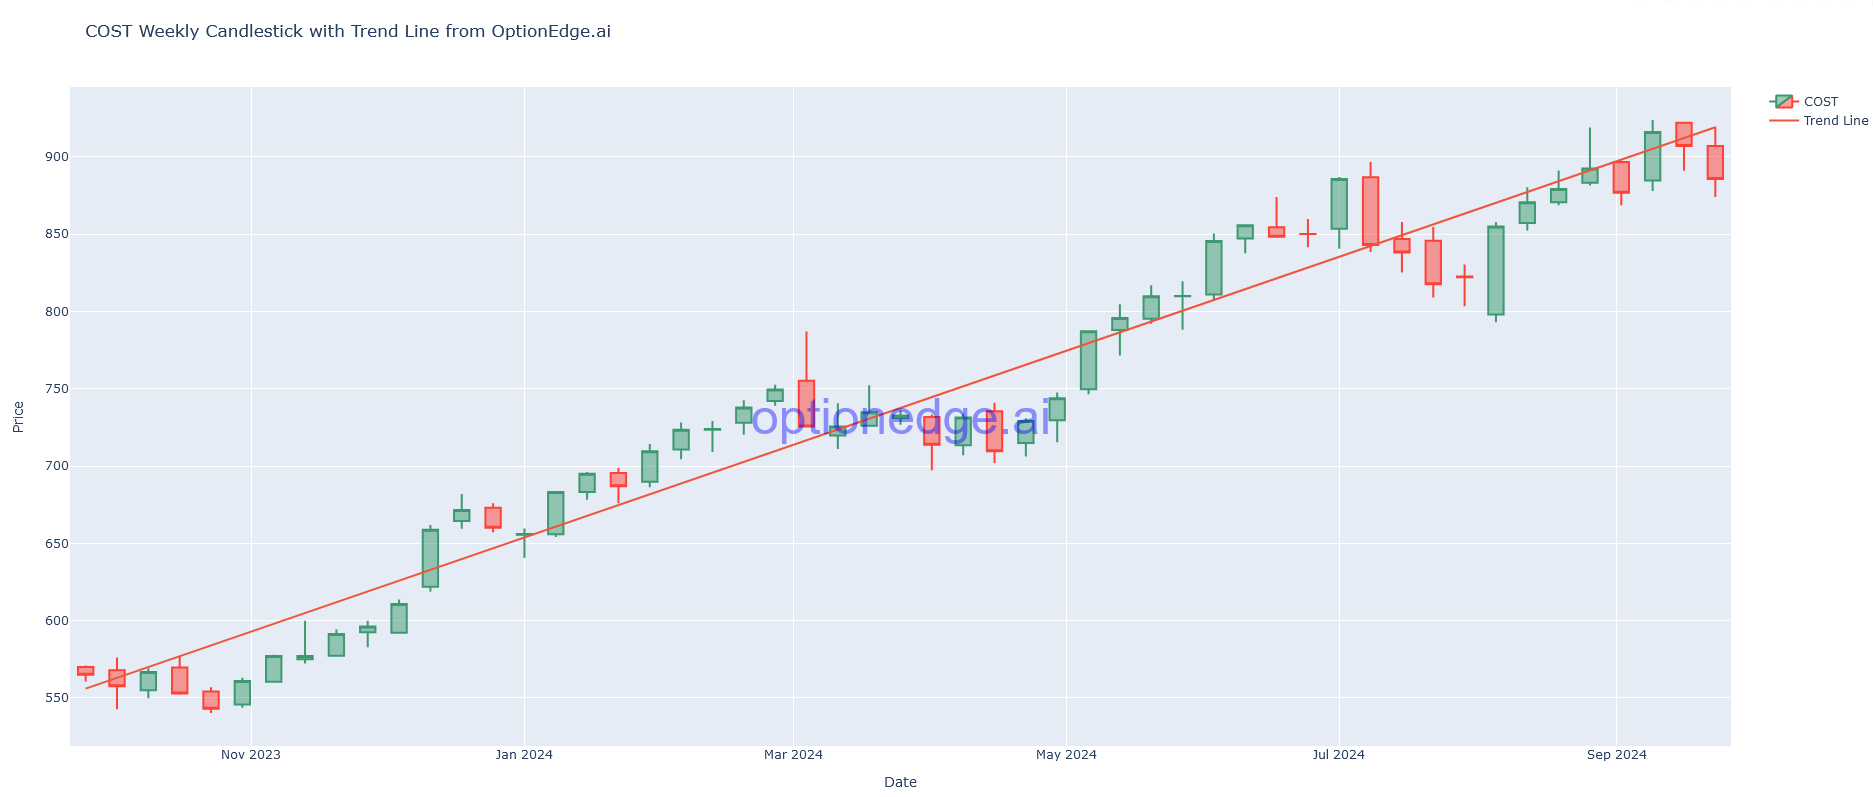
- COST: The weekly candle shows that it is currently below the trendline. However, Costco usually does not remain below the trendline for long. We expect it to recover towards the trendline within a month.
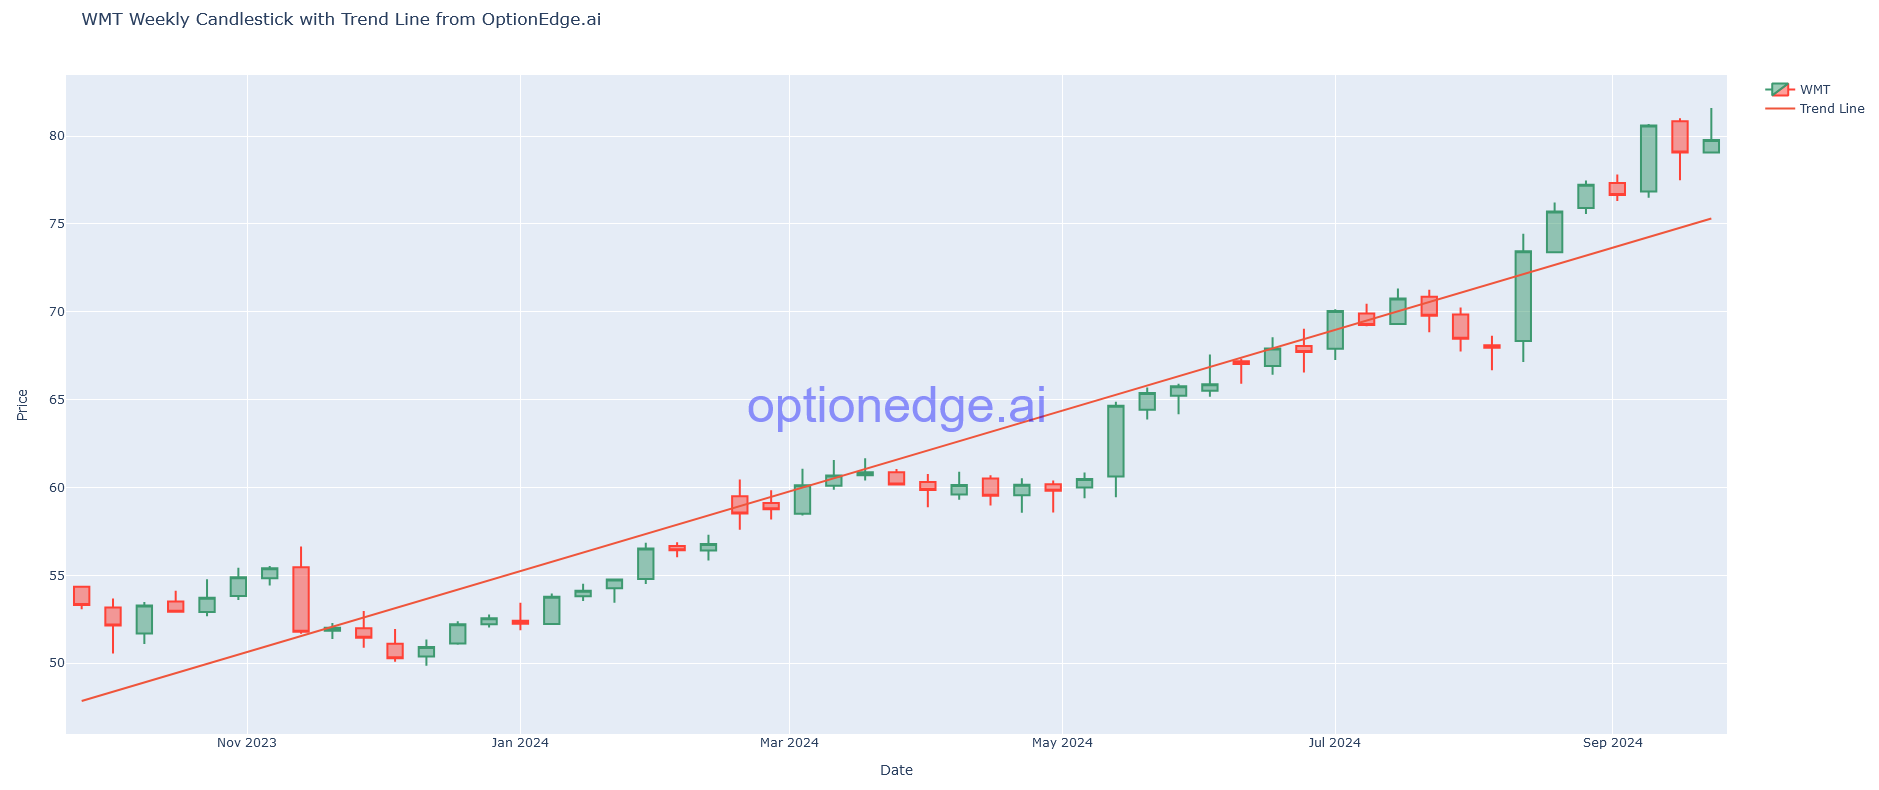
- WMT: The weekly candle indicates that it is building momentum and staying above the trendline. Similar to Costco, Walmart also tends to perform well in October.
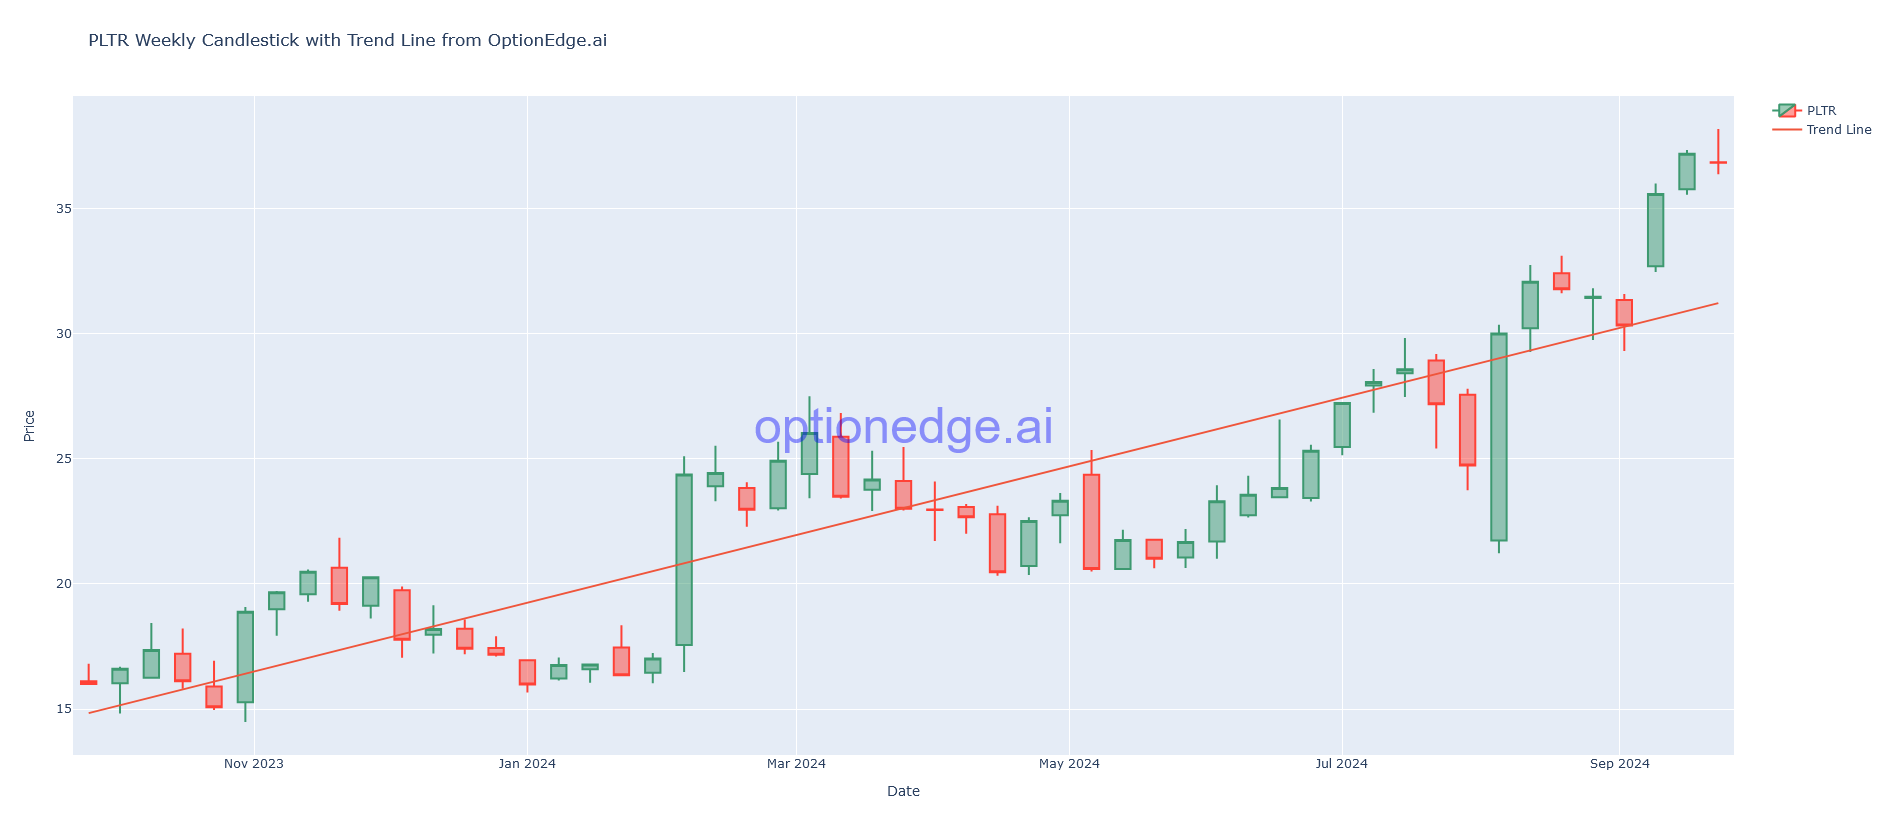
- PLTR: The weekly candle suggests that it is building momentum and remaining above the trendline. It is one of the leaders in AI and data science. The technical indicators are excellent, and following its addition to the S&P, it is expected to show resilience. However, October is typically not a great month for technology stocks, so proceed with caution. Nevertheless, we strongly believe it could reach between 45 and 48 by year-end.
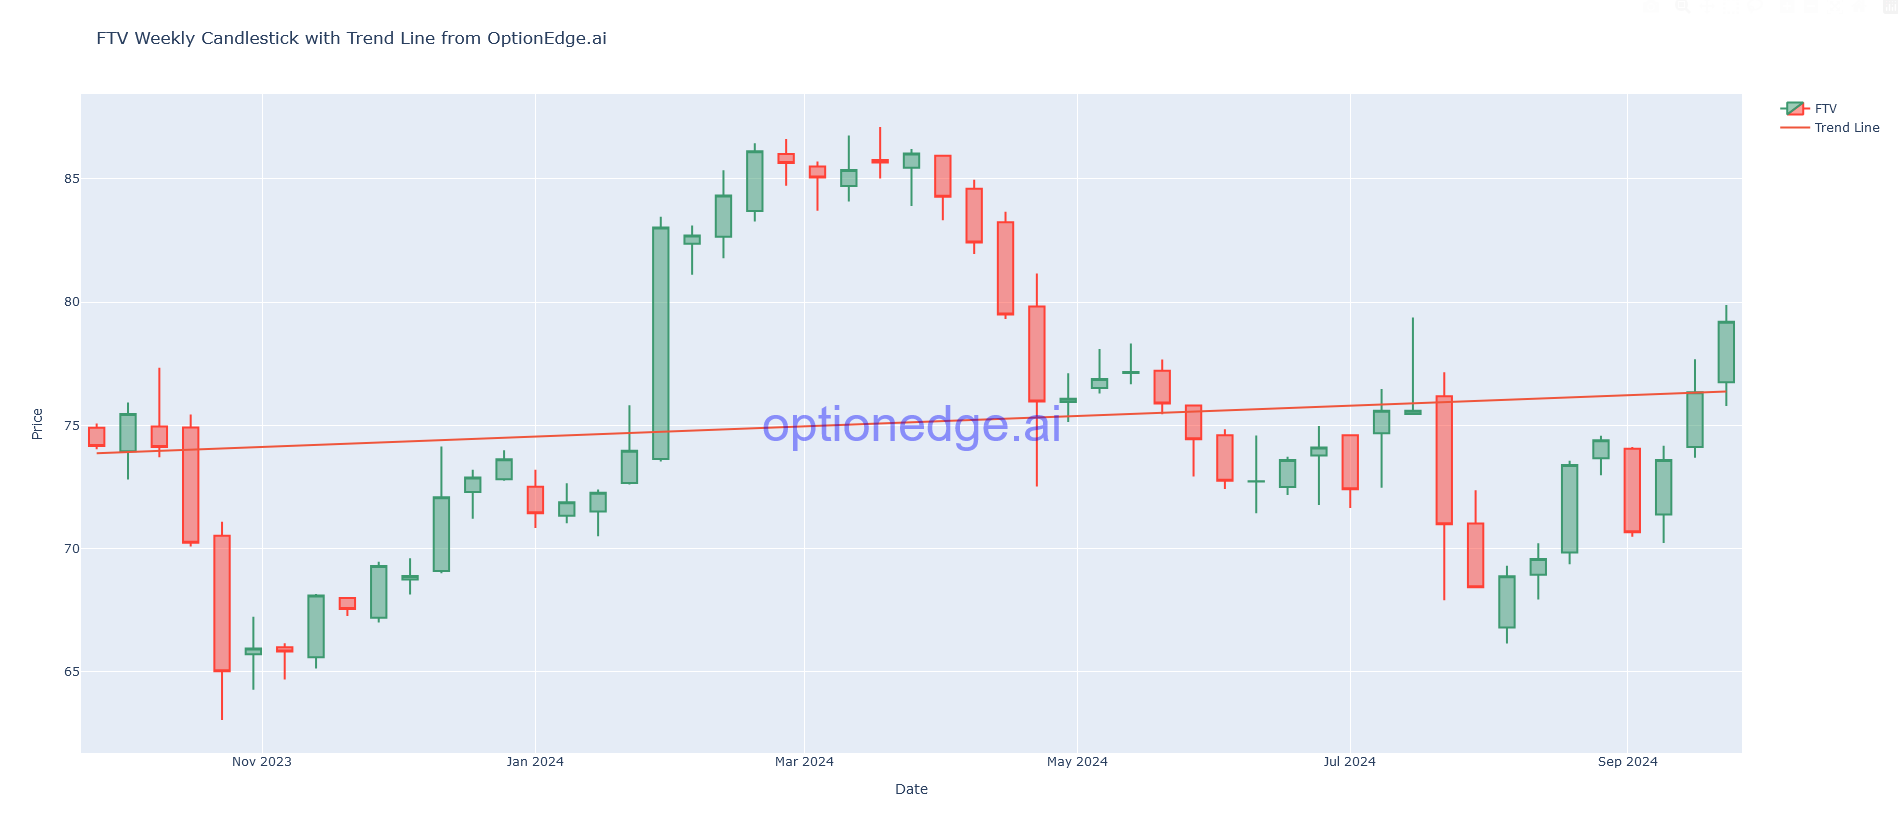
- FTV: The weekly candle indicates that it is breaking out above the trendline. However, being in the chip business and leveraging the AI boom, its performance could be affected by any news related to tariffs from China. Our quant model predicts it could reach between 83 and 85 before retracing.
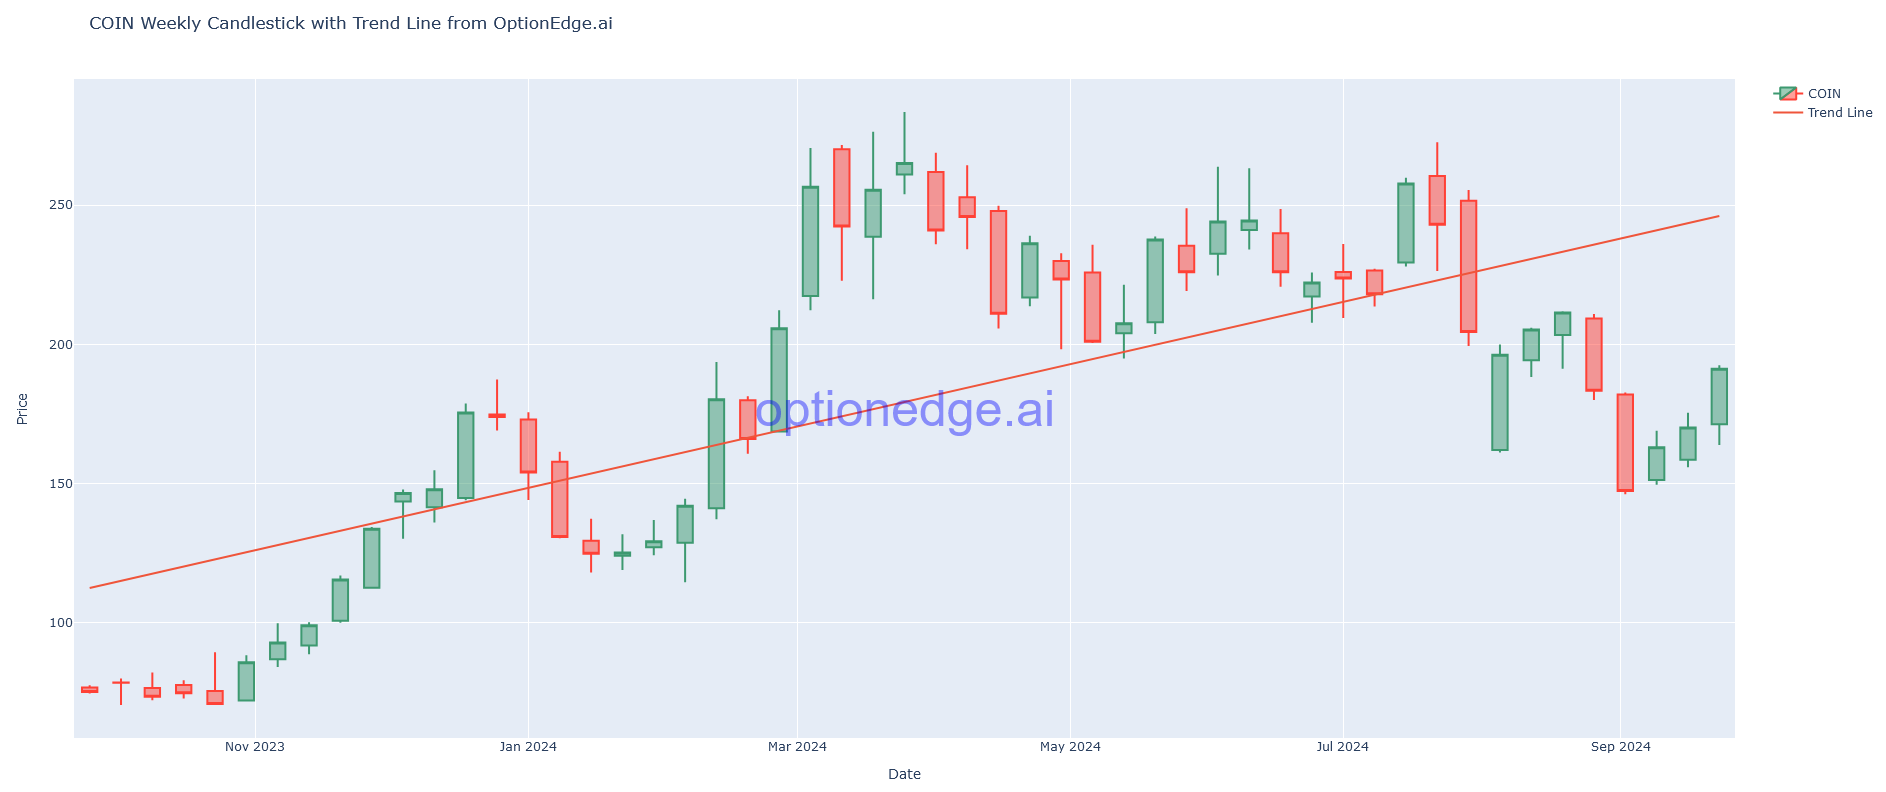
- COIN: The weekly candle indicates that it is consolidating below the trendline. Its performance is directly correlated with Bitcoin (BTC). Recent announcements from Yellen regarding a windfall tax on Bitcoin may impact its performance. However, our quant model expects it to move closer to the trendline within the next month.
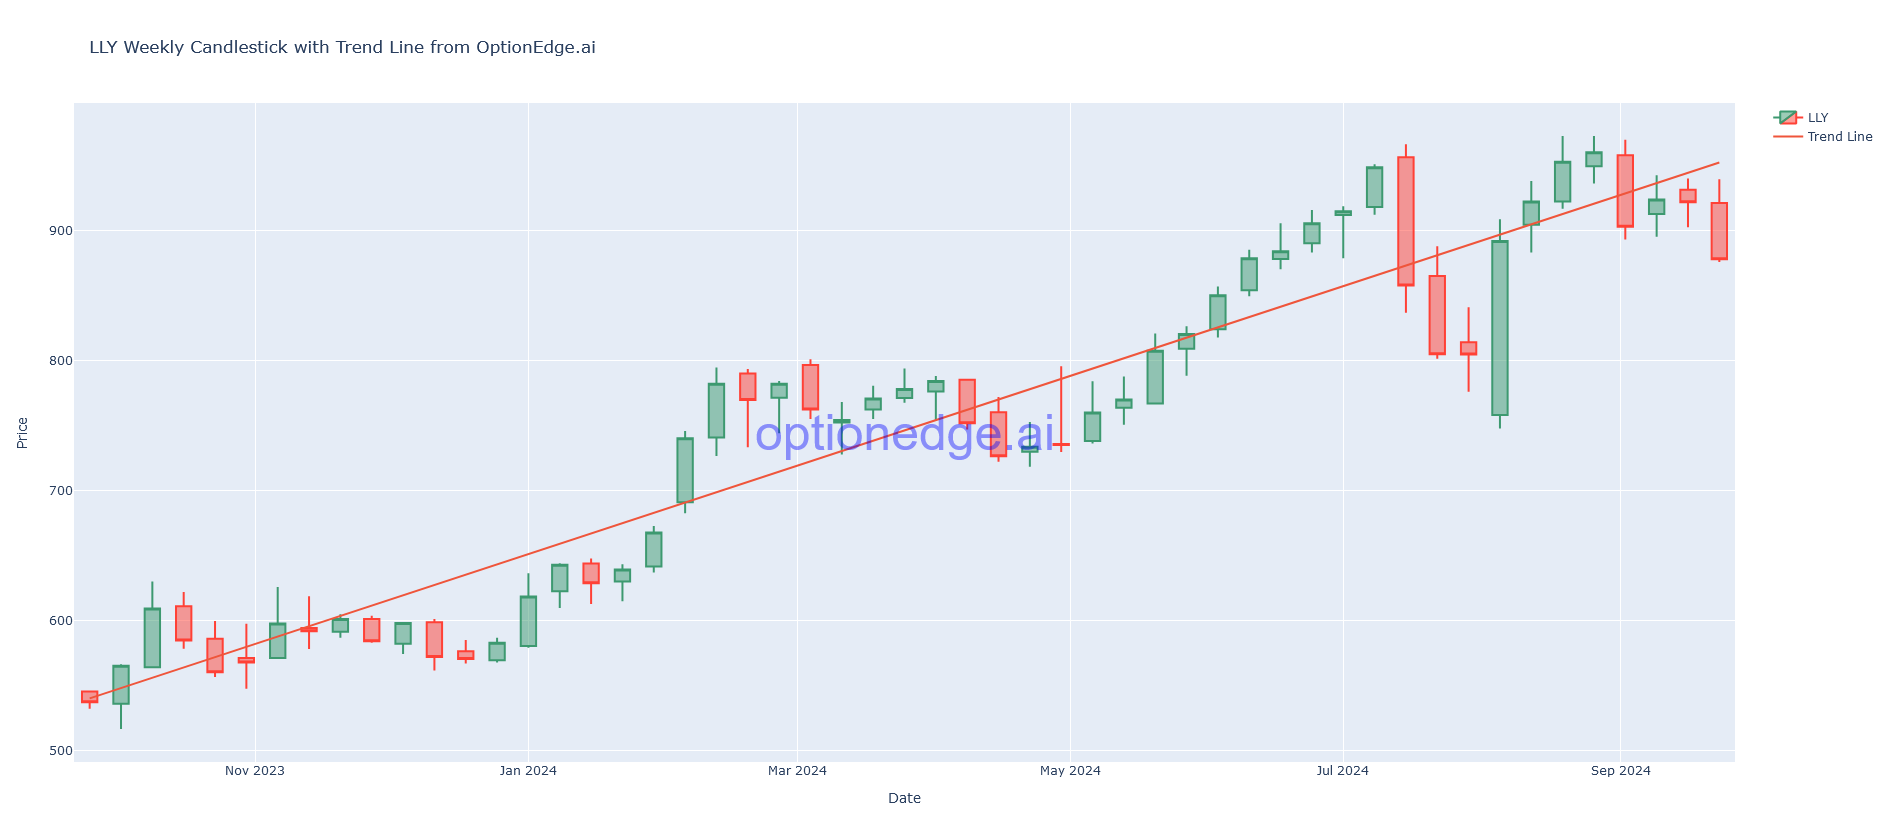
- LLY: The weekly candle indicates that it is dipping below the trendline. However, it usually does not stay below the trendline for long, so we expect a significant green candle in the coming month. Additionally, our quant model predicts that it could become the first trillion-dollar market cap company in the pharma sector by next year. Keep a close watch on this stock.
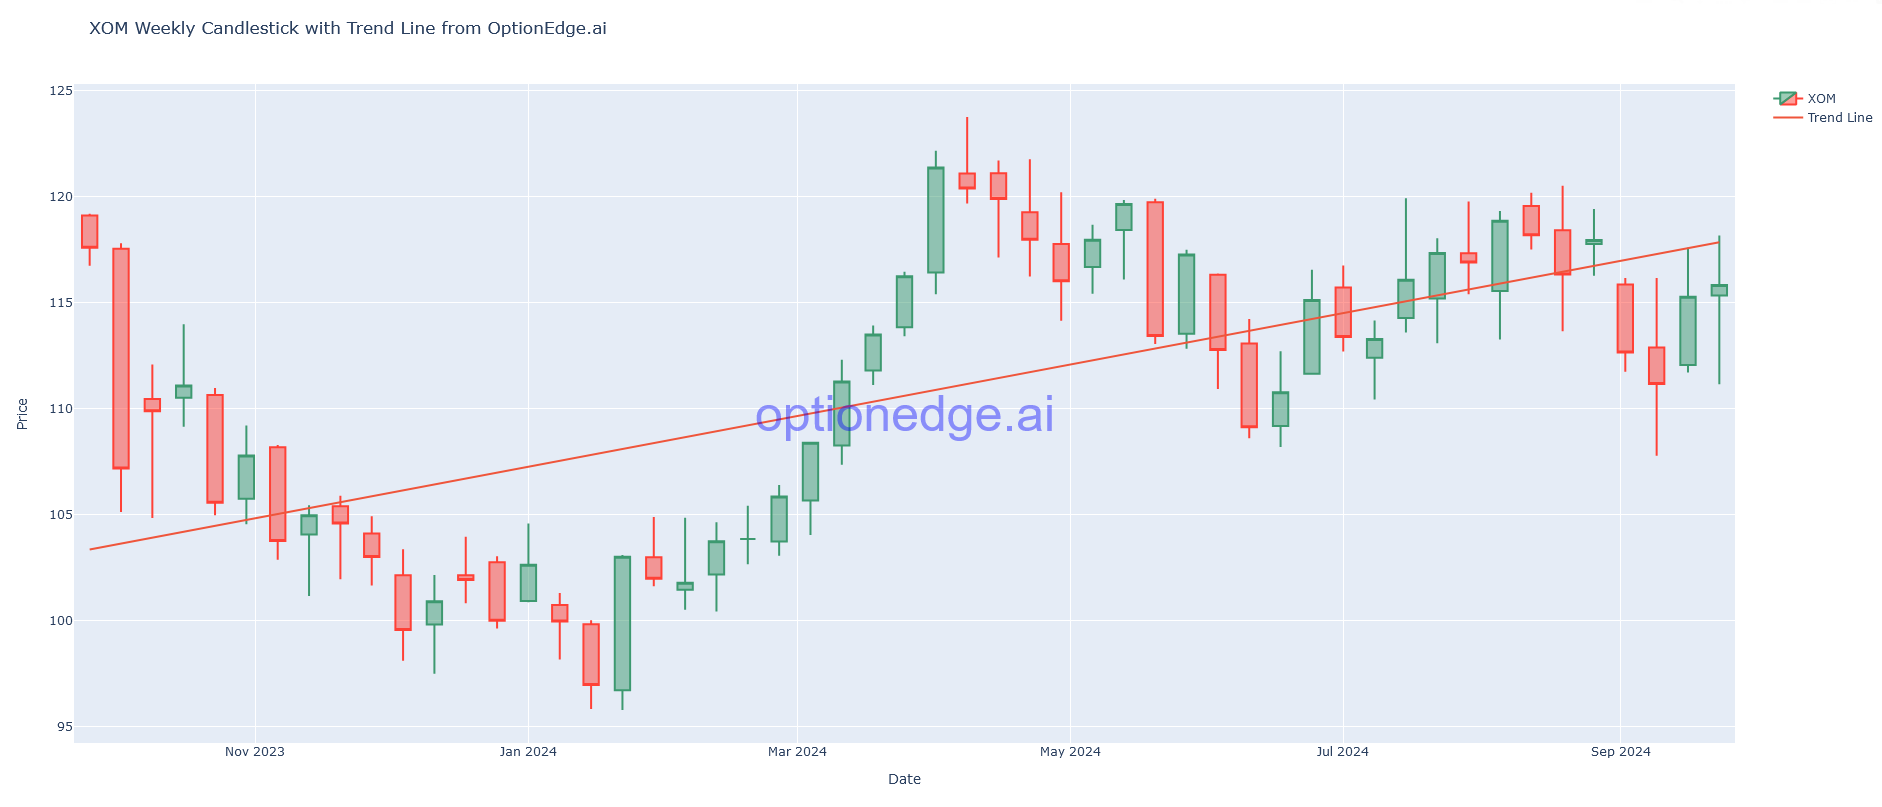
- XOM: The weekly candle shows that it is also below the trendline. Due to geopolitical tensions, it is receiving support; otherwise, the price would likely approach pre-COVID levels. Our quant model predicts it will retrace to test levels around 112 and then 110. We expect it to consolidate around 110 over the next 2 to 3 weeks.
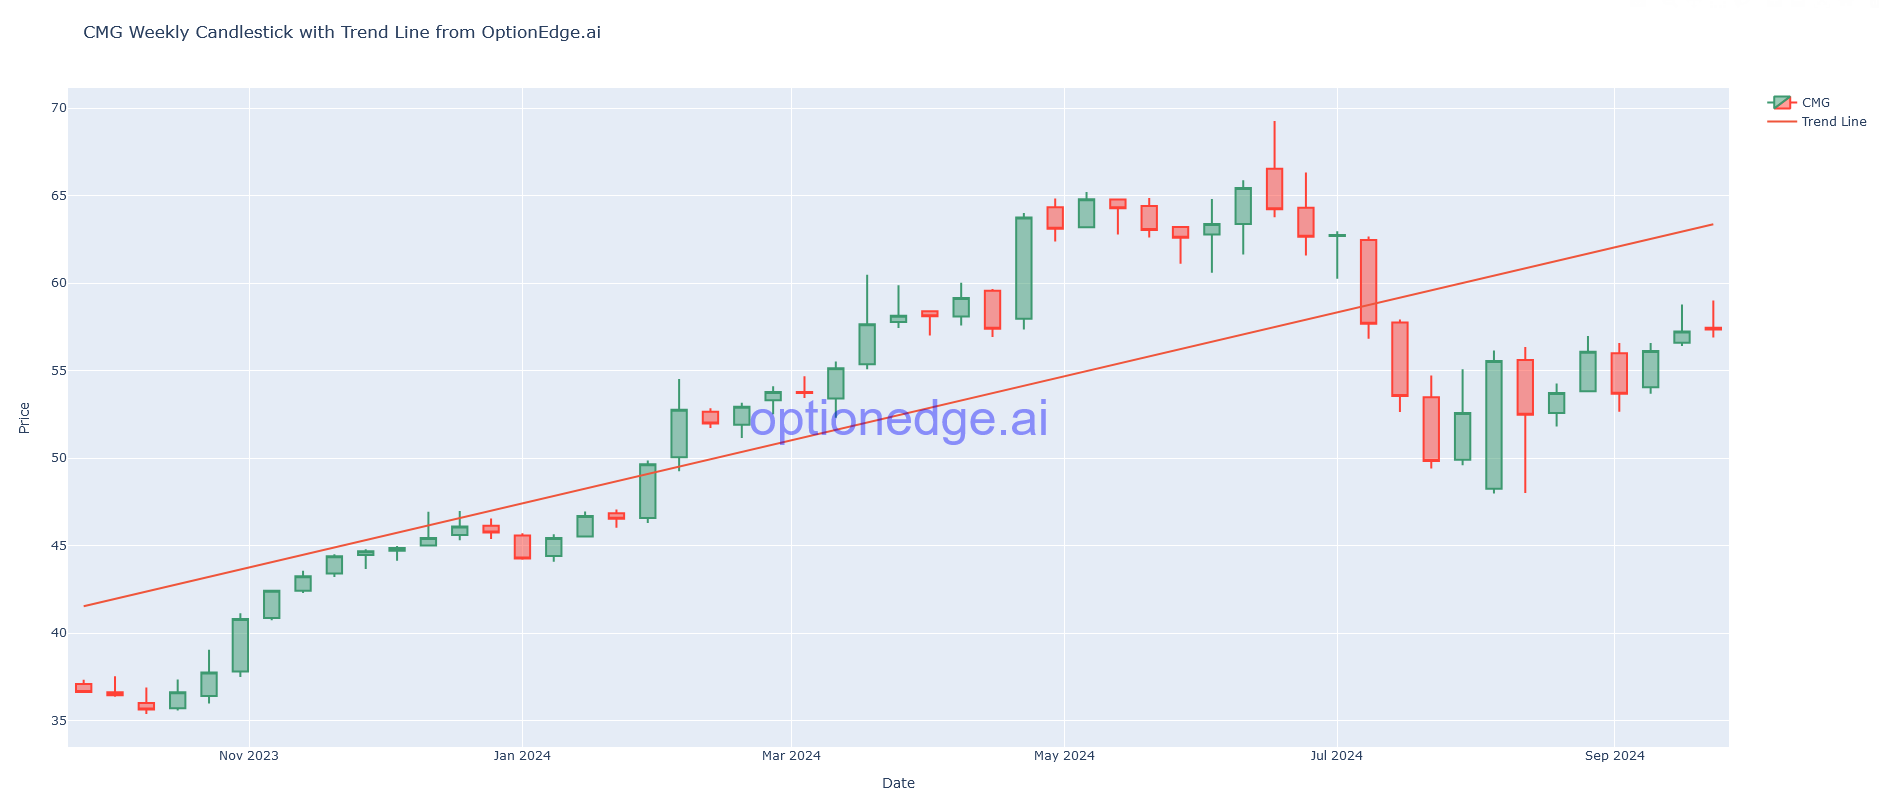
- CMG: The weekly candle indicates that it has been hovering below the trendline for quite some time. Since the CEO moved to Starbucks, it has struggled to recover. However, according to our quant model, it is time for CMG to resume its uptrend towards the trendline. A rate cut by the Fed would greatly benefit companies like CMG, and any easing of inflation would positively impact its EPS. Therefore, we expect CMG to move towards the range of 58 to 60 soon.
🔥 Featured Trade Idea: SPY 🔥
Rationale: Our AI quant model expects SPY to remain volatile, with the potential to test levels of 565 and 556 within the next month. Caution is advised, as inflation and payroll data remain key concerns.
💡 Trading Tip of the Week: Using the "Iron Condor" Strategy for Market Consolidation 💡
Consider using an "Iron Condor" strategy when the market is expected to trade in a range. This options strategy involves selling both a call and a put at different strike prices while also buying a call and a put at more distant strikes to limit risk. This setup allows you to profit from low volatility, which could be useful in periods of market consolidation, like the one we may currently be seeing.